
Advertisement
- Australia
- /
- Hospitality
- /
- ASX:ENN
Loss-making Elanor Investors Group (ASX:ENN) sheds a further AU$18m, taking total shareholder losses to 39% over 3 years

Many investors define successful investing as beating the market average over the long term. But in any portfolio, there are likely to be some stocks that fall short of that benchmark. Unfortunately, that's been the case for longer term Elanor Investors Group (ASX:ENN) shareholders, since the share price is down 48% in the last three years, falling well short of the market return of around 18%. The more recent news is of little comfort, with the share price down 40% in a year. Furthermore, it's down 15% in about a quarter. That's not much fun for holders.
Since Elanor Investors Group has shed AU$18m from its value in the past 7 days, let's see if the longer term decline has been driven by the business' economics.
Check out our latest analysis for Elanor Investors Group
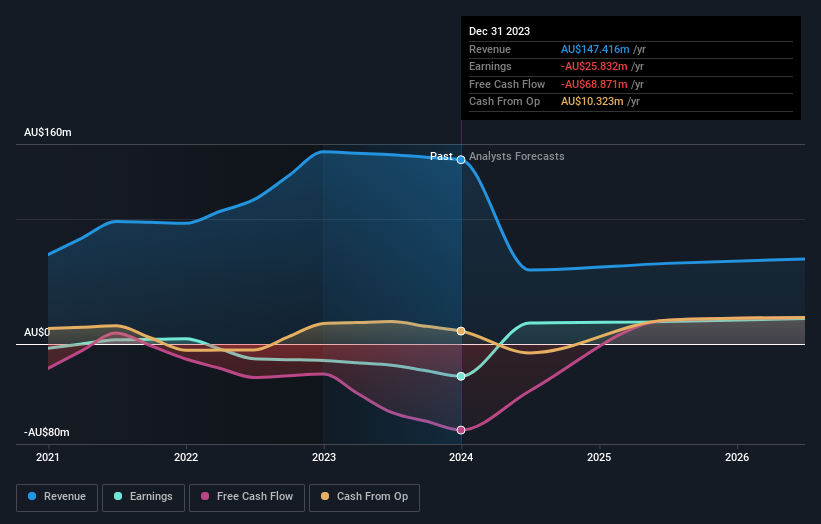
Given that Elanor Investors Group didn't make a profit in the last twelve months, we'll focus on revenue growth to form a quick view of its business development. Generally speaking, companies without profits are expected to grow revenue every year, and at a good clip. As you can imagine, fast revenue growth, when maintained, often leads to fast profit growth.
In the last three years, Elanor Investors Group saw its revenue grow by 24% per year, compound. That's well above most other pre-profit companies. While its revenue increased, the share price dropped at a rate of 14% per year. That seems like an unlucky result for holders. It seems likely that actual growth fell short of shareholders' expectations. Still, with high hopes now tempered, now might prove to be an opportunity to buy.
You can see below how earnings and revenue have changed over time (discover the exact values by clicking on the image).
You can see how its balance sheet has strengthened (or weakened) over time in this free interactive graphic.
What About Dividends?
When looking at investment returns, it is important to consider the difference between total shareholder return (TSR) and share price return. The TSR is a return calculation that accounts for the value of cash dividends (assuming that any dividend received was reinvested) and the calculated value of any discounted capital raisings and spin-offs. So for companies that pay a generous dividend, the TSR is often a lot higher than the share price return. As it happens, Elanor Investors Group's TSR for the last 3 years was -39%, which exceeds the share price return mentioned earlier. This is largely a result of its dividend payments!
A Different Perspective
Investors in Elanor Investors Group had a tough year, with a total loss of 38% (including dividends), against a market gain of about 14%. However, keep in mind that even the best stocks will sometimes underperform the market over a twelve month period. Unfortunately, last year's performance may indicate unresolved challenges, given that it was worse than the annualised loss of 5% over the last half decade. We realise that Baron Rothschild has said investors should "buy when there is blood on the streets", but we caution that investors should first be sure they are buying a high quality business. It's always interesting to track share price performance over the longer term. But to understand Elanor Investors Group better, we need to consider many other factors. Even so, be aware that Elanor Investors Group is showing 4 warning signs in our investment analysis , and 2 of those shouldn't be ignored...
Of course, you might find a fantastic investment by looking elsewhere. So take a peek at this free list of companies we expect will grow earnings.
Please note, the market returns quoted in this article reflect the market weighted average returns of stocks that currently trade on Australian exchanges.
Valuation is complex, but we're here to simplify it.
Discover if Elanor Investors Group might be undervalued or overvalued with our detailed analysis, featuring fair value estimates, potential risks, dividends, insider trades, and its financial condition.
Access Free AnalysisHave feedback on this article? Concerned about the content? Get in touch with us directly. Alternatively, email editorial-team (at) simplywallst.com.
This article by Simply Wall St is general in nature. We provide commentary based on historical data and analyst forecasts only using an unbiased methodology and our articles are not intended to be financial advice. It does not constitute a recommendation to buy or sell any stock, and does not take account of your objectives, or your financial situation. We aim to bring you long-term focused analysis driven by fundamental data. Note that our analysis may not factor in the latest price-sensitive company announcements or qualitative material. Simply Wall St has no position in any stocks mentioned.
Have feedback on this article? Concerned about the content? Get in touch with us directly. Alternatively, email editorial-team@simplywallst.com
About ASX:ENN
Moderate and slightly overvalued.
Similar Companies
Market Insights

Advertisement
Community Narratives
Pinterest will surge as advertising innovations ignite revenue growth
Fair Value US$42.63|27.1% undervalued
BR
Community Contributor
Brambles' Revenue Set to Climb 14% with Profit Margins Following
Fair Value AU$21.90|5.9% overvalued
RO
Community Contributor
Challenging Future for STG as Organic Sales Decline by 8.8%
Fair Value DKK 116.13|26.8% undervalued
KA
Community Contributor