
Advertisement
Finding a business that has the potential to grow substantially is not easy, but it is possible if we look at a few key financial metrics. One common approach is to try and find a company with returns on capital employed (ROCE) that are increasing, in conjunction with a growing amount of capital employed. This shows us that it's a compounding machine, able to continually reinvest its earnings back into the business and generate higher returns. So, when we ran our eye over Metcash's (ASX:MTS) trend of ROCE, we liked what we saw.
Our free stock report includes 2 warning signs investors should be aware of before investing in Metcash. Read for free now.What Is Return On Capital Employed (ROCE)?
Just to clarify if you're unsure, ROCE is a metric for evaluating how much pre-tax income (in percentage terms) a company earns on the capital invested in its business. The formula for this calculation on Metcash is:
Return on Capital Employed = Earnings Before Interest and Tax (EBIT) ÷ (Total Assets - Current Liabilities)
0.13 = AU$466m ÷ (AU$7.0b - AU$3.3b) (Based on the trailing twelve months to October 2024).
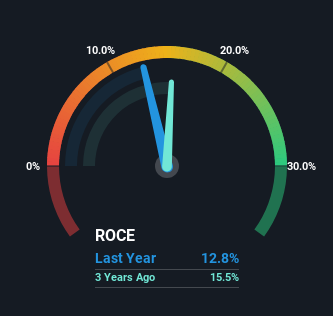
So, Metcash has an ROCE of 13%. By itself that's a normal return on capital and it's in line with the industry's average returns of 13%.
Check out our latest analysis for Metcash
In the above chart we have measured Metcash's prior ROCE against its prior performance, but the future is arguably more important. If you're interested, you can view the analysts predictions in our free analyst report for Metcash .
What Can We Tell From Metcash's ROCE Trend?
The trend of ROCE doesn't stand out much, but returns on a whole are decent. The company has consistently earned 13% for the last five years, and the capital employed within the business has risen 78% in that time. 13% is a pretty standard return, and it provides some comfort knowing that Metcash has consistently earned this amount. Over long periods of time, returns like these might not be too exciting, but with consistency they can pay off in terms of share price returns.
Another thing to note, Metcash has a high ratio of current liabilities to total assets of 48%. This effectively means that suppliers (or short-term creditors) are funding a large portion of the business, so just be aware that this can introduce some elements of risk. While it's not necessarily a bad thing, it can be beneficial if this ratio is lower.
The Bottom Line
The main thing to remember is that Metcash has proven its ability to continually reinvest at respectable rates of return. And the stock has followed suit returning a meaningful 75% to shareholders over the last five years. So while the positive underlying trends may be accounted for by investors, we still think this stock is worth looking into further.
On a final note, we've found 2 warning signs for Metcash that we think you should be aware of.
While Metcash isn't earning the highest return, check out this free list of companies that are earning high returns on equity with solid balance sheets.
New: Manage All Your Stock Portfolios in One Place
We've created the ultimate portfolio companion for stock investors, and it's free.
• Connect an unlimited number of Portfolios and see your total in one currency
• Be alerted to new Warning Signs or Risks via email or mobile
• Track the Fair Value of your stocks
Have feedback on this article? Concerned about the content? Get in touch with us directly. Alternatively, email editorial-team (at) simplywallst.com.
This article by Simply Wall St is general in nature. We provide commentary based on historical data and analyst forecasts only using an unbiased methodology and our articles are not intended to be financial advice. It does not constitute a recommendation to buy or sell any stock, and does not take account of your objectives, or your financial situation. We aim to bring you long-term focused analysis driven by fundamental data. Note that our analysis may not factor in the latest price-sensitive company announcements or qualitative material. Simply Wall St has no position in any stocks mentioned.
About ASX:MTS
Metcash
Operates as a wholesale distribution and marketing company in Australia.
Undervalued with excellent balance sheet.
Similar Companies
Market Insights

Advertisement
Community Narratives
The Next Phase of Energy Storage: How NeoVolta Is Tackling America’s Power Crunch
Fair Value US$7.50|35.2% undervalued
MA
Community Contributor
Why EnSilica is Worth Possibly 13x its Current Price
Fair Value UK£5.00|89.8% undervalued
DO
Community Contributor
M&A Activity, Industry Diversification & A Defense Contract Monopoly Will Push BWXT For Healthy Long-Term Growth
Fair Value US$220.00|15.6% undervalued
CL
Community Contributor
A case for Cassiar Gold Corp (TSXV: GLDC) to reach CAD$8-10 before 2030 (X30-37)
Fair Value CA$10.00|97.1% undervalued
AG
Community Contributor