
Advertisement
Globe International (ASX:GLB) shareholders notch a 20% CAGR over 5 years, yet earnings have been shrinking

Stock pickers are generally looking for stocks that will outperform the broader market. And while active stock picking involves risks (and requires diversification) it can also provide excess returns. For example, the Globe International Limited (ASX:GLB) share price is up 85% in the last 5 years, clearly besting the market return of around 23% (ignoring dividends). However, more recent returns haven't been as impressive as that, with the stock returning just 16% in the last year , including dividends .
The past week has proven to be lucrative for Globe International investors, so let's see if fundamentals drove the company's five-year performance.
Check out our latest analysis for Globe International
To quote Buffett, 'Ships will sail around the world but the Flat Earth Society will flourish. There will continue to be wide discrepancies between price and value in the marketplace...' One imperfect but simple way to consider how the market perception of a company has shifted is to compare the change in the earnings per share (EPS) with the share price movement.
Globe International's earnings per share are down 6.4% per year, despite strong share price performance over five years.
Essentially, it doesn't seem likely that investors are focused on EPS. Since the change in EPS doesn't seem to correlate with the change in share price, it's worth taking a look at other metrics.
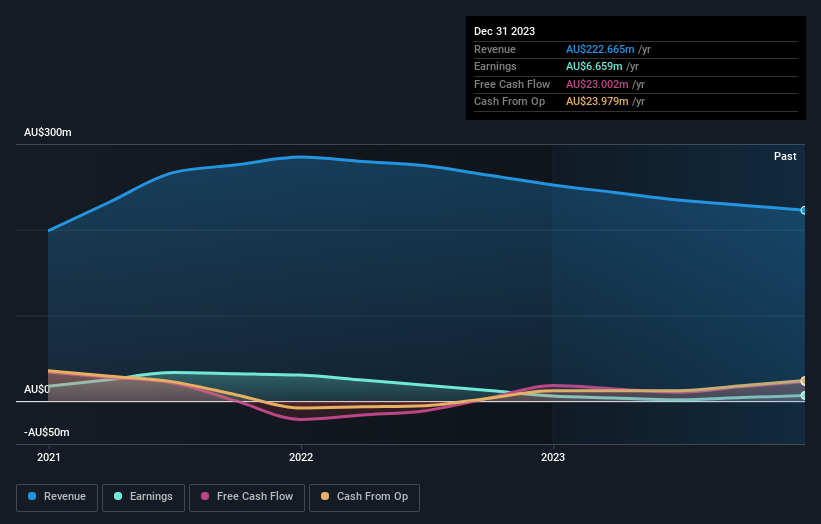
On the other hand, Globe International's revenue is growing nicely, at a compound rate of 11% over the last five years. It's quite possible that management are prioritizing revenue growth over EPS growth at the moment.
You can see how earnings and revenue have changed over time in the image below (click on the chart to see the exact values).
This free interactive report on Globe International's balance sheet strength is a great place to start, if you want to investigate the stock further.
What About Dividends?
It is important to consider the total shareholder return, as well as the share price return, for any given stock. The TSR is a return calculation that accounts for the value of cash dividends (assuming that any dividend received was reinvested) and the calculated value of any discounted capital raisings and spin-offs. It's fair to say that the TSR gives a more complete picture for stocks that pay a dividend. In the case of Globe International, it has a TSR of 151% for the last 5 years. That exceeds its share price return that we previously mentioned. And there's no prize for guessing that the dividend payments largely explain the divergence!
A Different Perspective
It's nice to see that Globe International shareholders have received a total shareholder return of 16% over the last year. Of course, that includes the dividend. Having said that, the five-year TSR of 20% a year, is even better. While it is well worth considering the different impacts that market conditions can have on the share price, there are other factors that are even more important. Like risks, for instance. Every company has them, and we've spotted 3 warning signs for Globe International (of which 2 shouldn't be ignored!) you should know about.
But note: Globe International may not be the best stock to buy. So take a peek at this free list of interesting companies with past earnings growth (and further growth forecast).
Please note, the market returns quoted in this article reflect the market weighted average returns of stocks that currently trade on Australian exchanges.
New: Manage All Your Stock Portfolios in One Place
We've created the ultimate portfolio companion for stock investors, and it's free.
• Connect an unlimited number of Portfolios and see your total in one currency
• Be alerted to new Warning Signs or Risks via email or mobile
• Track the Fair Value of your stocks
Have feedback on this article? Concerned about the content? Get in touch with us directly. Alternatively, email editorial-team (at) simplywallst.com.
This article by Simply Wall St is general in nature. We provide commentary based on historical data and analyst forecasts only using an unbiased methodology and our articles are not intended to be financial advice. It does not constitute a recommendation to buy or sell any stock, and does not take account of your objectives, or your financial situation. We aim to bring you long-term focused analysis driven by fundamental data. Note that our analysis may not factor in the latest price-sensitive company announcements or qualitative material. Simply Wall St has no position in any stocks mentioned.
About ASX:GLB
Globe International
Designs, produces, and distributes purpose-built apparel, footwear, and skateboard hardgoods for the boardsports, street fashion, outdoor, and workwear markets in Australasia, North America, Europe, and internationally.
Excellent balance sheet established dividend payer.
Market Insights

Advertisement
Community Narratives
MicroStrategy: Volatile Gamble or Golden Opportunity?
Fair Value US$663.00|31.9% undervalued
BL
Community Contributor
Emerging Markets and Debt Reduction Will Propel Bath & Body Works Forward
Fair Value US$40.73|22.1% undervalued
ZW
Community Contributor
An amazing opportunity to potentially get a 100 bagger
Fair Value US$10.00|36.0% overvalued
DA
Community Contributor