
Advertisement
Legendary fund manager Li Lu (who Charlie Munger backed) once said, 'The biggest investment risk is not the volatility of prices, but whether you will suffer a permanent loss of capital.' When we think about how risky a company is, we always like to look at its use of debt, since debt overload can lead to ruin. Importantly, Oldfields Holdings Limited (ASX:OLH) does carry debt. But should shareholders be worried about its use of debt?
What Risk Does Debt Bring?
Generally speaking, debt only becomes a real problem when a company can't easily pay it off, either by raising capital or with its own cash flow. If things get really bad, the lenders can take control of the business. However, a more frequent (but still costly) occurrence is where a company must issue shares at bargain-basement prices, permanently diluting shareholders, just to shore up its balance sheet. Of course, debt can be an important tool in businesses, particularly capital heavy businesses. The first thing to do when considering how much debt a business uses is to look at its cash and debt together.
View our latest analysis for Oldfields Holdings
What Is Oldfields Holdings's Debt?
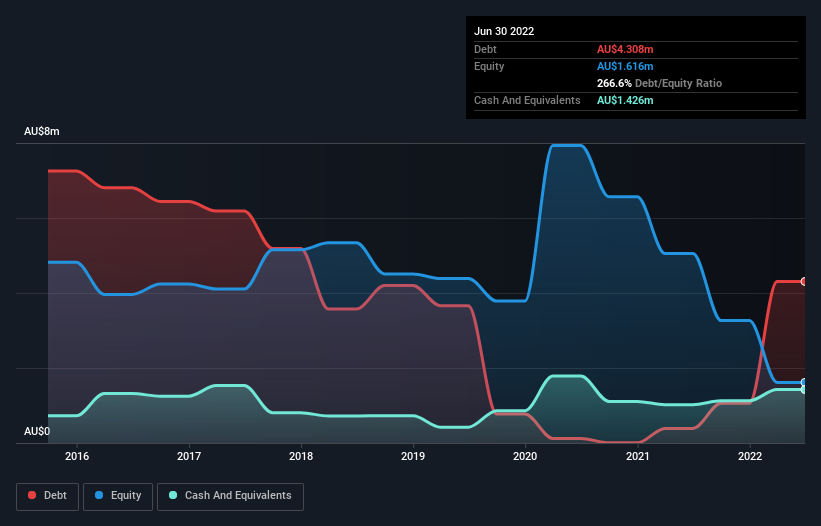
The image below, which you can click on for greater detail, shows that at June 2022 Oldfields Holdings had debt of AU$4.31m, up from AU$390.0k in one year. However, it also had AU$1.43m in cash, and so its net debt is AU$2.88m.
How Healthy Is Oldfields Holdings' Balance Sheet?
We can see from the most recent balance sheet that Oldfields Holdings had liabilities of AU$13.9m falling due within a year, and liabilities of AU$3.23m due beyond that. Offsetting these obligations, it had cash of AU$1.43m as well as receivables valued at AU$6.61m due within 12 months. So it has liabilities totalling AU$9.13m more than its cash and near-term receivables, combined.
This is a mountain of leverage relative to its market capitalization of AU$10.1m. This suggests shareholders would be heavily diluted if the company needed to shore up its balance sheet in a hurry. The balance sheet is clearly the area to focus on when you are analysing debt. But you can't view debt in total isolation; since Oldfields Holdings will need earnings to service that debt. So if you're keen to discover more about its earnings, it might be worth checking out this graph of its long term earnings trend.
In the last year Oldfields Holdings wasn't profitable at an EBIT level, but managed to grow its revenue by 7.7%, to AU$24m. We usually like to see faster growth from unprofitable companies, but each to their own.
Caveat Emptor
Over the last twelve months Oldfields Holdings produced an earnings before interest and tax (EBIT) loss. Indeed, it lost a very considerable AU$3.7m at the EBIT level. Considering that alongside the liabilities mentioned above does not give us much confidence that company should be using so much debt. So we think its balance sheet is a little strained, though not beyond repair. Another cause for caution is that is bled AU$2.3m in negative free cash flow over the last twelve months. So suffice it to say we consider the stock very risky. When analysing debt levels, the balance sheet is the obvious place to start. However, not all investment risk resides within the balance sheet - far from it. For example - Oldfields Holdings has 4 warning signs we think you should be aware of.
Of course, if you're the type of investor who prefers buying stocks without the burden of debt, then don't hesitate to discover our exclusive list of net cash growth stocks, today.
New: AI Stock Screener & Alerts
Our new AI Stock Screener scans the market every day to uncover opportunities.
• Dividend Powerhouses (3%+ Yield)
• Undervalued Small Caps with Insider Buying
• High growth Tech and AI Companies
Or build your own from over 50 metrics.
Have feedback on this article? Concerned about the content? Get in touch with us directly. Alternatively, email editorial-team (at) simplywallst.com.
This article by Simply Wall St is general in nature. We provide commentary based on historical data and analyst forecasts only using an unbiased methodology and our articles are not intended to be financial advice. It does not constitute a recommendation to buy or sell any stock, and does not take account of your objectives, or your financial situation. We aim to bring you long-term focused analysis driven by fundamental data. Note that our analysis may not factor in the latest price-sensitive company announcements or qualitative material. Simply Wall St has no position in any stocks mentioned.
About ASX:OLH
Oldfields Holdings
Engages in the provision of scaffolding and painting accessories in Australia, New Zealand, and internationally.
Medium-low risk and slightly overvalued.
Market Insights

Advertisement
Community Narratives
MicroVision will explode future revenue by 380.37% with a vision towards success
Fair Value US$60.00|98.5% undervalued
TH
Community Contributor
The Indispensable Artery for a New North American Economy
Fair Value CA$132.87|2.3% undervalued
TI
Community Contributor