Advertisement
- Australia
- /
- Construction
- /
- ASX:JLG
3 ASX Penny Stocks With Market Caps Larger Than A$100M

Simply Wall St
Reviewed by Simply Wall St
The Australian market has recently hit three-week lows, influenced by Wall Street's subdued performance and unexpected domestic economic data. Despite these challenges, investors continue to explore opportunities beyond the major indices. Penny stocks, often representing smaller or newer companies, remain a relevant area for investment as they can offer growth potential at lower price points. By focusing on those with robust financials and clear growth trajectories, investors can uncover promising opportunities in this often-overlooked segment of the market.
Top 10 Penny Stocks In Australia
| Name | Share Price | Market Cap | Rewards & Risks |
| Alfabs Australia (ASX:AAL) | A$0.48 | A$133.26M | ✅ 4 ⚠️ 3 View Analysis > |
| EZZ Life Science Holdings (ASX:EZZ) | A$2.13 | A$98.59M | ✅ 3 ⚠️ 3 View Analysis > |
| Dusk Group (ASX:DSK) | A$0.885 | A$54.17M | ✅ 4 ⚠️ 2 View Analysis > |
| IVE Group (ASX:IGL) | A$2.86 | A$434.5M | ✅ 4 ⚠️ 2 View Analysis > |
| Veris (ASX:VRS) | A$0.078 | A$37.8M | ✅ 4 ⚠️ 2 View Analysis > |
| SHAPE Australia (ASX:SHA) | A$4.11 | A$349.14M | ✅ 3 ⚠️ 1 View Analysis > |
| West African Resources (ASX:WAF) | A$3.04 | A$3.47B | ✅ 4 ⚠️ 1 View Analysis > |
| Tasmea (ASX:TEA) | A$4.10 | A$1.05B | ✅ 3 ⚠️ 2 View Analysis > |
| Praemium (ASX:PPS) | A$0.79 | A$375.39M | ✅ 5 ⚠️ 2 View Analysis > |
| Fleetwood (ASX:FWD) | A$3.09 | A$282.54M | ✅ 3 ⚠️ 2 View Analysis > |
Click here to see the full list of 442 stocks from our ASX Penny Stocks screener.
Here we highlight a subset of our preferred stocks from the screener.
Coast Entertainment Holdings (ASX:CEH)
Simply Wall St Financial Health Rating: ★★★★☆☆
Overview: Coast Entertainment Holdings Limited invests in, owns, and operates leisure and entertainment businesses in Australia with a market capitalization of A$169.02 million.
Operations: Coast Entertainment Holdings generates revenue of A$96.40 million from its Theme Parks & Attractions segment.
Market Cap: A$169.02M
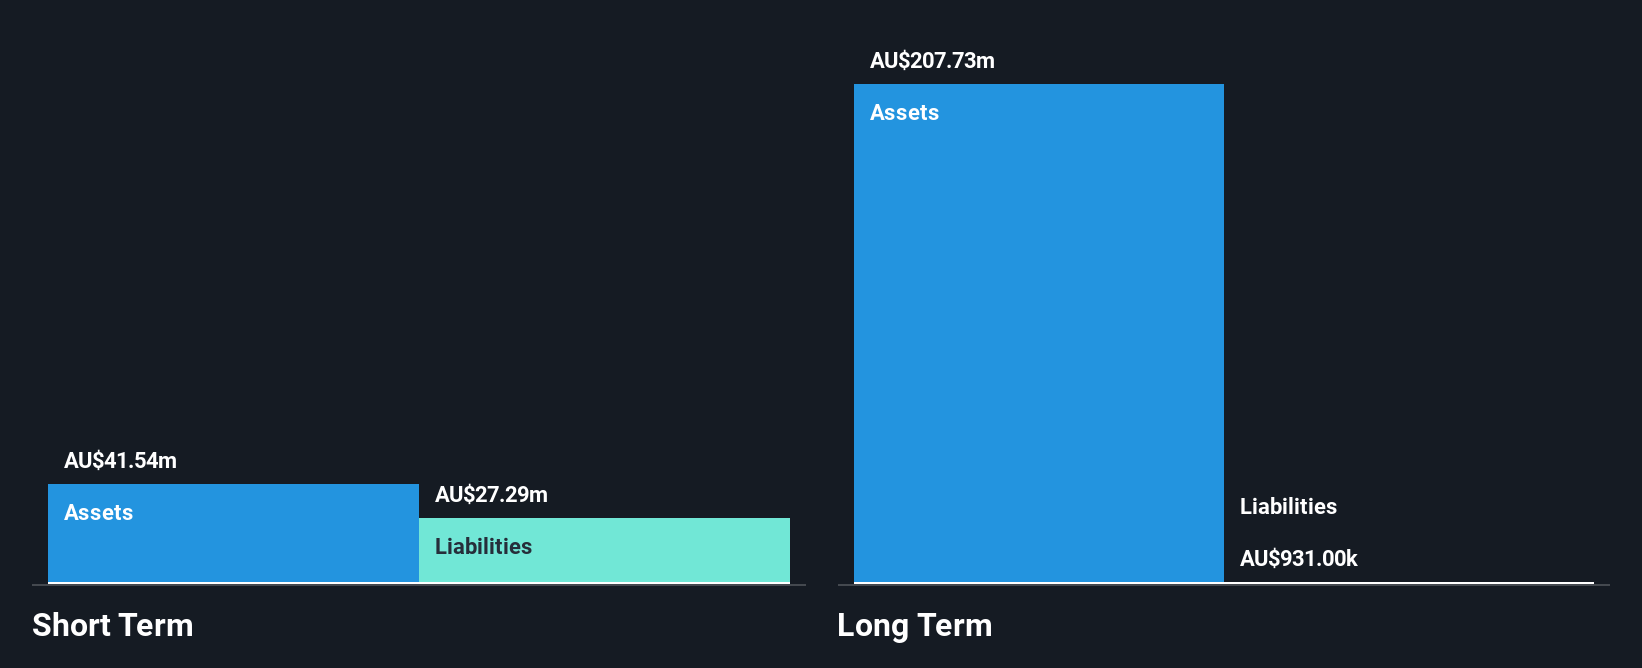
Coast Entertainment Holdings has demonstrated resilience despite being unprofitable, reducing losses by 57.9% annually over the past five years. The company reported A$105.22 million in revenue for the fiscal year ending June 2025, though it experienced a net loss of A$0.112 million compared to a profit the previous year. It maintains a strong balance sheet with short-term assets exceeding both short and long-term liabilities, and more cash than total debt. Recent share buybacks totaling 10.09% of shares indicate management's confidence in its value proposition, while earnings are projected to grow significantly at 62.44% per year.
- Click here to discover the nuances of Coast Entertainment Holdings with our detailed analytical financial health report.
- Gain insights into Coast Entertainment Holdings' future direction by reviewing our growth report.
Johns Lyng Group (ASX:JLG)
Simply Wall St Financial Health Rating: ★★★★★☆
Overview: Johns Lyng Group Limited offers integrated building services across Australia, New Zealand, and the United States, with a market capitalization of A$1.11 billion.
Operations: The company's revenue is primarily derived from Insurance Building and Restoration Services, which generated A$1.15 billion, followed by Commercial Building Services at A$66.20 million and Commercial Construction at A$6.65 million.
Market Cap: A$1.11B
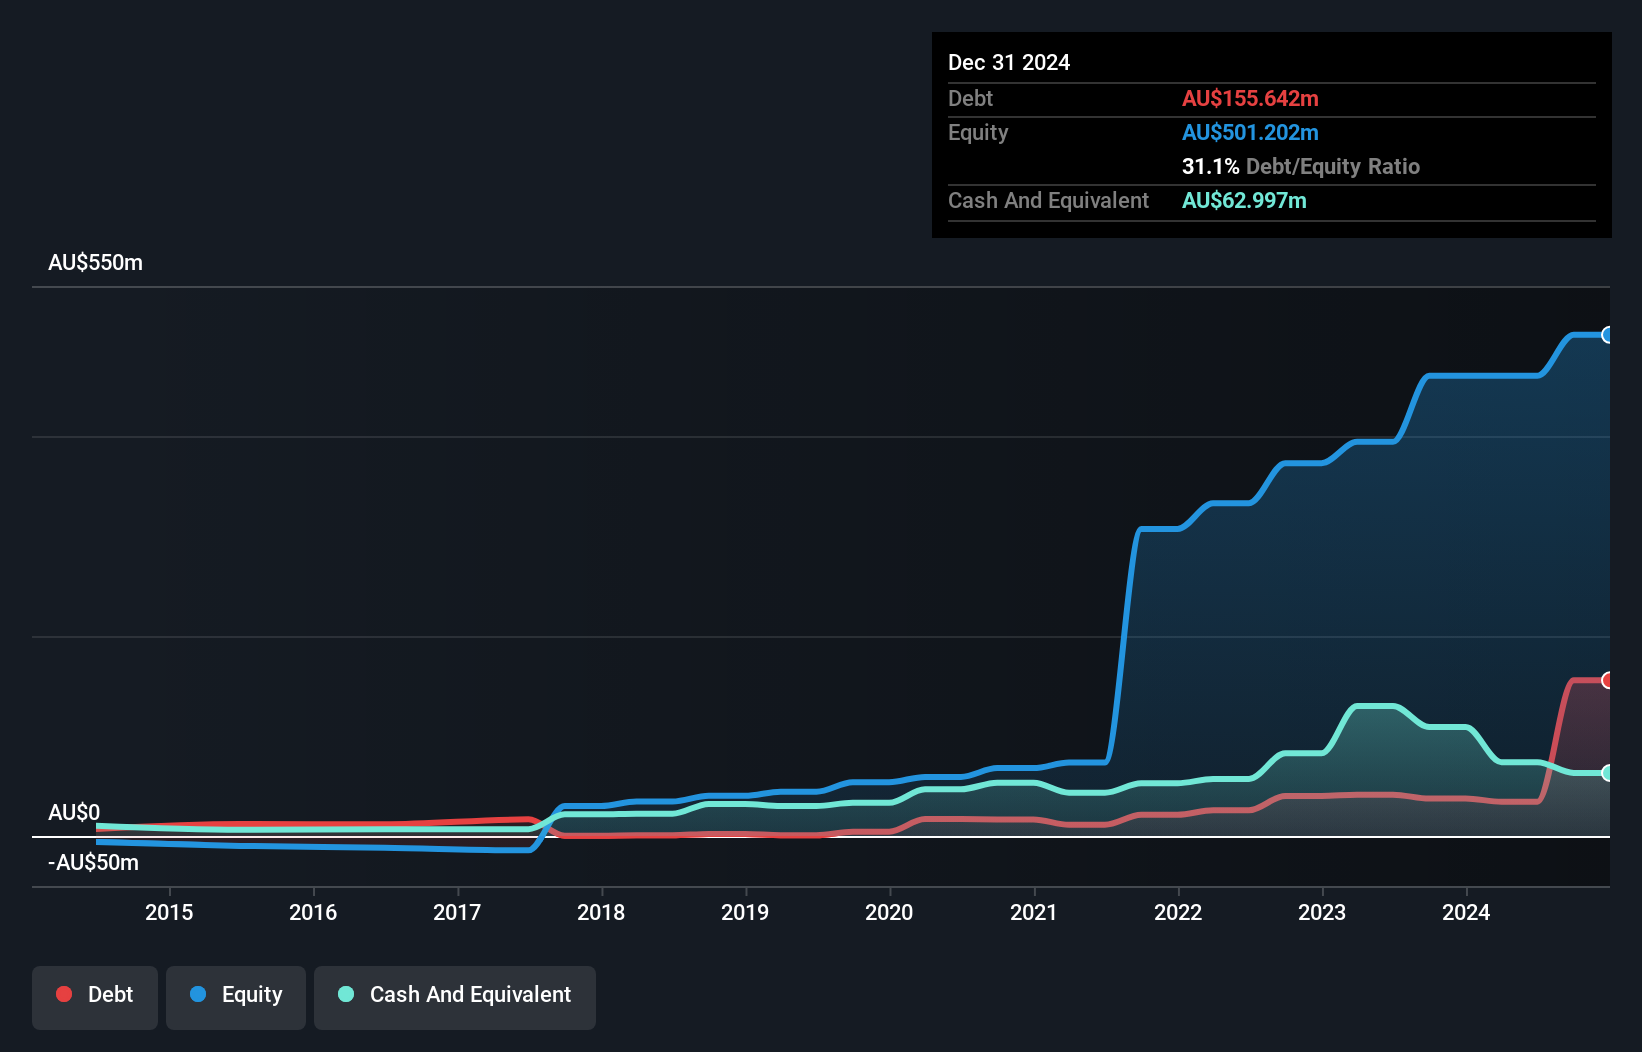
Johns Lyng Group Limited, with a market cap of A$1.11 billion, primarily generates revenue from Insurance Building and Restoration Services. Despite recent negative earnings growth of -22.7%, the company maintains high-quality earnings and covers its interest payments well, with EBIT at 9.1 times interest expenses. The board and management team are experienced, averaging over five years in tenure, which supports operational stability during strategic expansions into underpenetrated markets and the U.S., as announced in their fiscal year 2025 results call. Additionally, short-term assets exceed liabilities, indicating sound financial health amid acquisition pursuits.
- Click to explore a detailed breakdown of our findings in Johns Lyng Group's financial health report.
- Evaluate Johns Lyng Group's prospects by accessing our earnings growth report.
Tasmea (ASX:TEA)
Simply Wall St Financial Health Rating: ★★★★★☆
Overview: Tasmea Limited offers shutdown, maintenance, emergency breakdown, and capital upgrade services in Australia with a market cap of A$1.05 billion.
Operations: Tasmea Limited generates revenue from several segments, including Water & Fluid (A$87.06 million), Civil Services (A$103.07 million), Electrical Services (A$212.71 million), and Mechanical Services (A$144.87 million).
Market Cap: A$1.05B
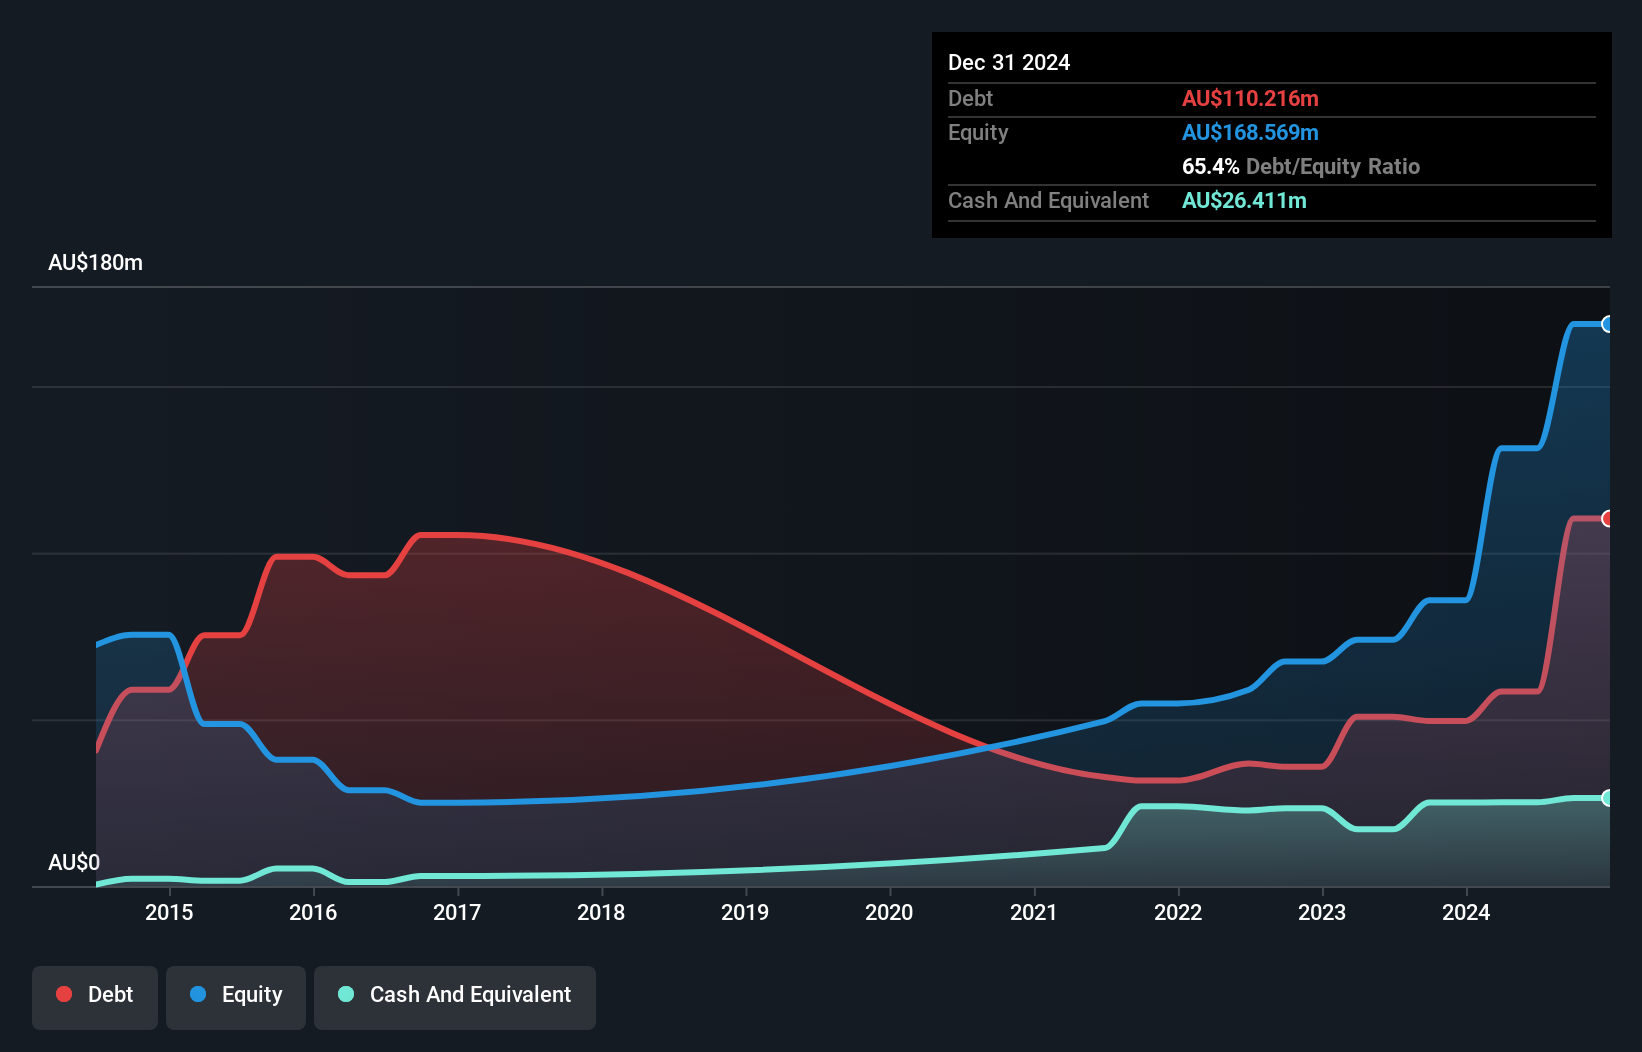
Tasmea Limited, with a market cap of A$1.05 billion, has demonstrated strong financial performance and growth potential. Its earnings grew by 74.9% over the past year, significantly outpacing the construction industry's average growth rate. Despite carrying a high net debt to equity ratio of 59.8%, its interest payments are well-covered by EBIT at 11.5 times coverage, indicating robust financial management. The company's short-term assets surpass both short- and long-term liabilities, underscoring solid liquidity positions while it targets further expansion and acquisitions supported by strategic dividend guidance for fiscal year 2026 with a payout ratio of up to 50% of NPAT.
- Navigate through the intricacies of Tasmea with our comprehensive balance sheet health report here.
- Learn about Tasmea's future growth trajectory here.
Key Takeaways
- Embark on your investment journey to our 442 ASX Penny Stocks selection here.
- Seeking Other Investments? Diversify your portfolio with solid dividend payers offering reliable income streams to weather potential market turbulence.
This article by Simply Wall St is general in nature. We provide commentary based on historical data and analyst forecasts only using an unbiased methodology and our articles are not intended to be financial advice. It does not constitute a recommendation to buy or sell any stock, and does not take account of your objectives, or your financial situation. We aim to bring you long-term focused analysis driven by fundamental data. Note that our analysis may not factor in the latest price-sensitive company announcements or qualitative material. Simply Wall St has no position in any stocks mentioned.
New: Manage All Your Stock Portfolios in One Place
We've created the ultimate portfolio companion for stock investors, and it's free.
• Connect an unlimited number of Portfolios and see your total in one currency
• Be alerted to new Warning Signs or Risks via email or mobile
• Track the Fair Value of your stocks
Have feedback on this article? Concerned about the content? Get in touch with us directly. Alternatively, email editorial-team@simplywallst.com
About ASX:JLG
Johns Lyng Group
Provides integrated building services in Australia, New Zealand, and the United States.
Excellent balance sheet and slightly overvalued.
Similar Companies
Market Insights

Advertisement
Community Narratives
MINISO's fair value is projected at 26.69 with an anticipated PE ratio shift of 20x
Fair Value US$24.03|11.4% undervalued
BE
Community Contributor
Procter & Gamble: A Dividend Giant Facing Slowing Growth
Fair Value US$119.81|23.5% overvalued
AN
Community Contributor
Eli Lilly's Future Growth Driven by Tirzepatide and Favorable Market Conditions
Fair Value US$1.19k|14.0% undervalued
EA
Community Contributor