David Iben put it well when he said, 'Volatility is not a risk we care about. What we care about is avoiding the permanent loss of capital.' So it might be obvious that you need to consider debt, when you think about how risky any given stock is, because too much debt can sink a company. We note that Coventry Group Ltd (ASX:CYG) does have debt on its balance sheet. But is this debt a concern to shareholders?
When Is Debt Dangerous?
Debt assists a business until the business has trouble paying it off, either with new capital or with free cash flow. If things get really bad, the lenders can take control of the business. However, a more frequent (but still costly) occurrence is where a company must issue shares at bargain-basement prices, permanently diluting shareholders, just to shore up its balance sheet. Having said that, the most common situation is where a company manages its debt reasonably well - and to its own advantage. The first step when considering a company's debt levels is to consider its cash and debt together.
See our latest analysis for Coventry Group
What Is Coventry Group's Debt?
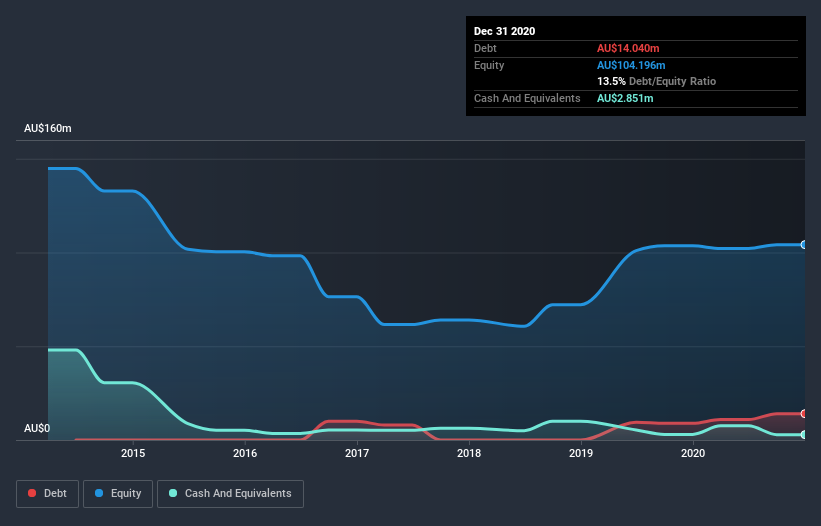
The image below, which you can click on for greater detail, shows that at December 2020 Coventry Group had debt of AU$14.0m, up from AU$8.87m in one year. However, it also had AU$2.85m in cash, and so its net debt is AU$11.2m.

How Healthy Is Coventry Group's Balance Sheet?
The latest balance sheet data shows that Coventry Group had liabilities of AU$70.8m due within a year, and liabilities of AU$49.2m falling due after that. Offsetting this, it had AU$2.85m in cash and AU$36.6m in receivables that were due within 12 months. So its liabilities total AU$80.5m more than the combination of its cash and short-term receivables.
This deficit is considerable relative to its market capitalization of AU$101.7m, so it does suggest shareholders should keep an eye on Coventry Group's use of debt. Should its lenders demand that it shore up the balance sheet, shareholders would likely face severe dilution.
In order to size up a company's debt relative to its earnings, we calculate its net debt divided by its earnings before interest, tax, depreciation, and amortization (EBITDA) and its earnings before interest and tax (EBIT) divided by its interest expense (its interest cover). Thus we consider debt relative to earnings both with and without depreciation and amortization expenses.
Given net debt is only 1.3 times EBITDA, it is initially surprising to see that Coventry Group's EBIT has low interest coverage of 1.3 times. So while we're not necessarily alarmed we think that its debt is far from trivial. Pleasingly, Coventry Group is growing its EBIT faster than former Australian PM Bob Hawke downs a yard glass, boasting a 138% gain in the last twelve months. The balance sheet is clearly the area to focus on when you are analysing debt. But you can't view debt in total isolation; since Coventry Group will need earnings to service that debt. So if you're keen to discover more about its earnings, it might be worth checking out this graph of its long term earnings trend.
Finally, while the tax-man may adore accounting profits, lenders only accept cold hard cash. So the logical step is to look at the proportion of that EBIT that is matched by actual free cash flow. Over the most recent two years, Coventry Group recorded free cash flow worth 79% of its EBIT, which is around normal, given free cash flow excludes interest and tax. This cold hard cash means it can reduce its debt when it wants to.
Our View
Both Coventry Group's ability to to grow its EBIT and its conversion of EBIT to free cash flow gave us comfort that it can handle its debt. But truth be told its interest cover had us nibbling our nails. When we consider all the elements mentioned above, it seems to us that Coventry Group is managing its debt quite well. But a word of caution: we think debt levels are high enough to justify ongoing monitoring. When analysing debt levels, the balance sheet is the obvious place to start. However, not all investment risk resides within the balance sheet - far from it. Be aware that Coventry Group is showing 3 warning signs in our investment analysis , you should know about...
At the end of the day, it's often better to focus on companies that are free from net debt. You can access our special list of such companies (all with a track record of profit growth). It's free.
If you’re looking to trade Coventry Group, open an account with the lowest-cost* platform trusted by professionals, Interactive Brokers. Their clients from over 200 countries and territories trade stocks, options, futures, forex, bonds and funds worldwide from a single integrated account. Promoted
New: AI Stock Screener & Alerts
Our new AI Stock Screener scans the market every day to uncover opportunities.
• Dividend Powerhouses (3%+ Yield)
• Undervalued Small Caps with Insider Buying
• High growth Tech and AI Companies
Or build your own from over 50 metrics.
This article by Simply Wall St is general in nature. It does not constitute a recommendation to buy or sell any stock, and does not take account of your objectives, or your financial situation. We aim to bring you long-term focused analysis driven by fundamental data. Note that our analysis may not factor in the latest price-sensitive company announcements or qualitative material. Simply Wall St has no position in any stocks mentioned.
*Interactive Brokers Rated Lowest Cost Broker by StockBrokers.com Annual Online Review 2020
Have feedback on this article? Concerned about the content? Get in touch with us directly. Alternatively, email editorial-team (at) simplywallst.com.
About ASX:CYG
Coventry Group
Distributes industrial products and services in Australia and New Zealand.
Undervalued with adequate balance sheet.
Market Insights
Community Narratives


