
Advertisement
- Australia
- /
- Trade Distributors
- /
- ASX:CYG
Coventry Group's (ASX:CYG) Returns On Capital Are Heading Higher
There are a few key trends to look for if we want to identify the next multi-bagger. In a perfect world, we'd like to see a company investing more capital into its business and ideally the returns earned from that capital are also increasing. Put simply, these types of businesses are compounding machines, meaning they are continually reinvesting their earnings at ever-higher rates of return. So when we looked at Coventry Group (ASX:CYG) and its trend of ROCE, we really liked what we saw.
Return On Capital Employed (ROCE): What Is It?
Just to clarify if you're unsure, ROCE is a metric for evaluating how much pre-tax income (in percentage terms) a company earns on the capital invested in its business. Analysts use this formula to calculate it for Coventry Group:
Return on Capital Employed = Earnings Before Interest and Tax (EBIT) ÷ (Total Assets - Current Liabilities)
0.051 = AU$12m ÷ (AU$346m - AU$118m) (Based on the trailing twelve months to December 2024).
Therefore, Coventry Group has an ROCE of 5.1%. Ultimately, that's a low return and it under-performs the Trade Distributors industry average of 12%.
Check out our latest analysis for Coventry Group
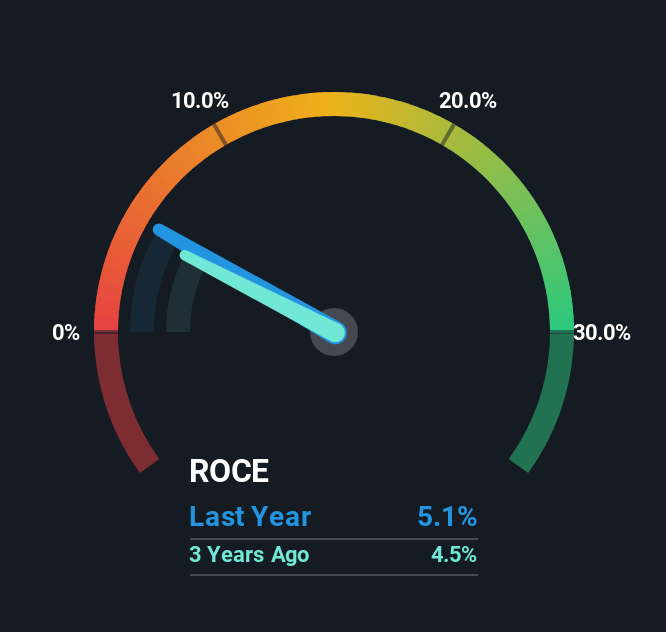
Historical performance is a great place to start when researching a stock so above you can see the gauge for Coventry Group's ROCE against it's prior returns. If you're interested in investigating Coventry Group's past further, check out this free graph covering Coventry Group's past earnings, revenue and cash flow.
How Are Returns Trending?
We're glad to see that ROCE is heading in the right direction, even if it is still low at the moment. Over the last five years, returns on capital employed have risen substantially to 5.1%. Basically the business is earning more per dollar of capital invested and in addition to that, 51% more capital is being employed now too. This can indicate that there's plenty of opportunities to invest capital internally and at ever higher rates, a combination that's common among multi-baggers.
In Conclusion...
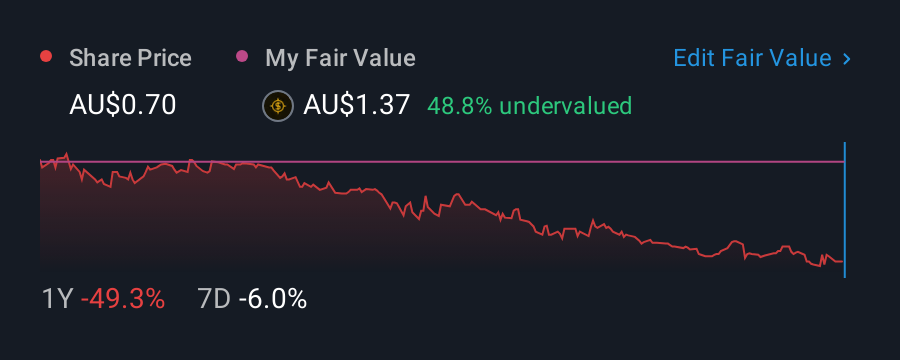
In summary, it's great to see that Coventry Group can compound returns by consistently reinvesting capital at increasing rates of return, because these are some of the key ingredients of those highly sought after multi-baggers. Since the stock has only returned 20% to shareholders over the last five years, the promising fundamentals may not be recognized yet by investors. Given that, we'd look further into this stock in case it has more traits that could make it multiply in the long term.
One more thing, we've spotted 3 warning signs facing Coventry Group that you might find interesting.
While Coventry Group isn't earning the highest return, check out this free list of companies that are earning high returns on equity with solid balance sheets.
New: AI Stock Screener & Alerts
Our new AI Stock Screener scans the market every day to uncover opportunities.
• Dividend Powerhouses (3%+ Yield)
• Undervalued Small Caps with Insider Buying
• High growth Tech and AI Companies
Or build your own from over 50 metrics.
Have feedback on this article? Concerned about the content? Get in touch with us directly. Alternatively, email editorial-team (at) simplywallst.com.
This article by Simply Wall St is general in nature. We provide commentary based on historical data and analyst forecasts only using an unbiased methodology and our articles are not intended to be financial advice. It does not constitute a recommendation to buy or sell any stock, and does not take account of your objectives, or your financial situation. We aim to bring you long-term focused analysis driven by fundamental data. Note that our analysis may not factor in the latest price-sensitive company announcements or qualitative material. Simply Wall St has no position in any stocks mentioned.
About ASX:CYG
Coventry Group
Distributes industrial products and services in Australia and New Zealand.
Undervalued with adequate balance sheet.
Market Insights

Advertisement
Community Narratives
MINISO's fair value is projected at 26.69 with an anticipated PE ratio shift of 20x
Fair Value US$24.03|11.0% undervalued
BE
Community Contributor
Procter & Gamble: A Dividend Giant Facing Slowing Growth
Fair Value US$119.81|23.3% overvalued
AN
Community Contributor
Eli Lilly's Future Growth Driven by Tirzepatide and Favorable Market Conditions
Fair Value US$1.19k|13.8% undervalued
EA
Community Contributor