- Australia
- /
- Auto Components
- /
- ASX:AOV
Are GUD Holdings Limited's (ASX:GUD) Fundamentals Good Enough to Warrant Buying Given The Stock's Recent Weakness?


With its stock down 17% over the past three months, it is easy to disregard GUD Holdings (ASX:GUD). However, stock prices are usually driven by a company’s financials over the long term, which in this case look pretty respectable. In this article, we decided to focus on GUD Holdings' ROE.
ROE or return on equity is a useful tool to assess how effectively a company can generate returns on the investment it received from its shareholders. In simpler terms, it measures the profitability of a company in relation to shareholder's equity.
View our latest analysis for GUD Holdings
How Do You Calculate Return On Equity?
The formula for ROE is:
Return on Equity = Net Profit (from continuing operations) ÷ Shareholders' Equity
So, based on the above formula, the ROE for GUD Holdings is:
12% = AU$107m ÷ AU$909m (Based on the trailing twelve months to December 2023).
The 'return' is the yearly profit. One way to conceptualize this is that for each A$1 of shareholders' capital it has, the company made A$0.12 in profit.
Why Is ROE Important For Earnings Growth?
So far, we've learned that ROE is a measure of a company's profitability. Based on how much of its profits the company chooses to reinvest or "retain", we are then able to evaluate a company's future ability to generate profits. Assuming everything else remains unchanged, the higher the ROE and profit retention, the higher the growth rate of a company compared to companies that don't necessarily bear these characteristics.
GUD Holdings' Earnings Growth And 12% ROE
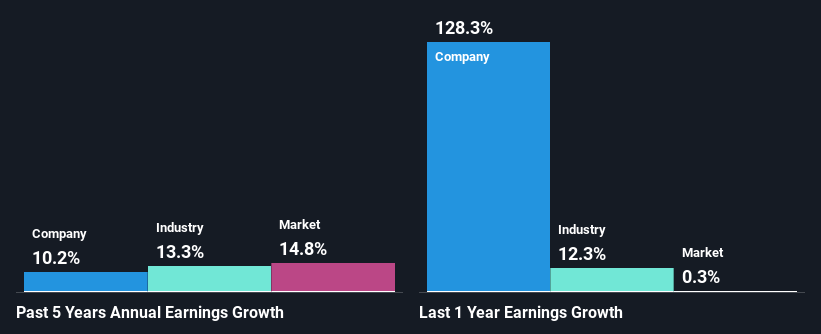
To begin with, GUD Holdings seems to have a respectable ROE. Further, the company's ROE is similar to the industry average of 12%. This certainly adds some context to GUD Holdings' moderate 10% net income growth seen over the past five years.
As a next step, we compared GUD Holdings' net income growth with the industry and were disappointed to see that the company's growth is lower than the industry average growth of 13% in the same period.
The basis for attaching value to a company is, to a great extent, tied to its earnings growth. It’s important for an investor to know whether the market has priced in the company's expected earnings growth (or decline). By doing so, they will have an idea if the stock is headed into clear blue waters or if swampy waters await. Has the market priced in the future outlook for GUD? You can find out in our latest intrinsic value infographic research report.
Is GUD Holdings Making Efficient Use Of Its Profits?
The high three-year median payout ratio of 87% (or a retention ratio of 13%) for GUD Holdings suggests that the company's growth wasn't really hampered despite it returning most of its income to its shareholders.
Moreover, GUD Holdings is determined to keep sharing its profits with shareholders which we infer from its long history of paying a dividend for at least ten years. Upon studying the latest analysts' consensus data, we found that the company's future payout ratio is expected to drop to 56% over the next three years. Regardless, the ROE is not expected to change much for the company despite the lower expected payout ratio.
Conclusion
In total, it does look like GUD Holdings has some positive aspects to its business. Its earnings growth is decent, and the high ROE does contribute to that growth. However, investors could have benefitted even more from the high ROE, had the company been reinvesting more of its earnings. With that said, the latest industry analyst forecasts reveal that the company's earnings growth is expected to slow down. To know more about the company's future earnings growth forecasts take a look at this free report on analyst forecasts for the company to find out more.
New: Manage All Your Stock Portfolios in One Place
We've created the ultimate portfolio companion for stock investors, and it's free.
• Connect an unlimited number of Portfolios and see your total in one currency
• Be alerted to new Warning Signs or Risks via email or mobile
• Track the Fair Value of your stocks
Have feedback on this article? Concerned about the content? Get in touch with us directly. Alternatively, email editorial-team (at) simplywallst.com.
This article by Simply Wall St is general in nature. We provide commentary based on historical data and analyst forecasts only using an unbiased methodology and our articles are not intended to be financial advice. It does not constitute a recommendation to buy or sell any stock, and does not take account of your objectives, or your financial situation. We aim to bring you long-term focused analysis driven by fundamental data. Note that our analysis may not factor in the latest price-sensitive company announcements or qualitative material. Simply Wall St has no position in any stocks mentioned.
About ASX:AOV
Amotiv
Through its subsidiaries, manufactures, imports, distributes, and sells automotive products in Australia, New Zealand, Thailand, South Korea, France, and the United States.
Very undervalued with excellent balance sheet and pays a dividend.
Similar Companies
Market Insights

Community Narratives

