
Advertisement
With A Return On Equity Of 7.4%, Has FBL Financial Group, Inc.'s (NYSE:FFG) Management Done Well?

Many investors are still learning about the various metrics that can be useful when analysing a stock. This article is for those who would like to learn about Return On Equity (ROE). We'll use ROE to examine FBL Financial Group, Inc. (NYSE:FFG), by way of a worked example.
Our data shows FBL Financial Group has a return on equity of 7.4% for the last year. One way to conceptualize this, is that for each $1 of shareholders' equity it has, the company made $0.074 in profit.
See our latest analysis for FBL Financial Group
How Do You Calculate Return On Equity?
The formula for ROE is:
Return on Equity = Net Profit ÷ Shareholders' Equity
Or for FBL Financial Group:
7.4% = US$104m ÷ US$1.4b (Based on the trailing twelve months to June 2019.)
Most know that net profit is the total earnings after all expenses, but the concept of shareholders' equity is a little more complicated. It is all the money paid into the company from shareholders, plus any earnings retained. You can calculate shareholders' equity by subtracting the company's total liabilities from its total assets.
What Does Return On Equity Mean?
Return on Equity measures a company's profitability against the profit it has kept for the business (plus any capital injections). The 'return' is the profit over the last twelve months. A higher profit will lead to a higher ROE. So, all else being equal, a high ROE is better than a low one. That means it can be interesting to compare the ROE of different companies.
Does FBL Financial Group Have A Good Return On Equity?
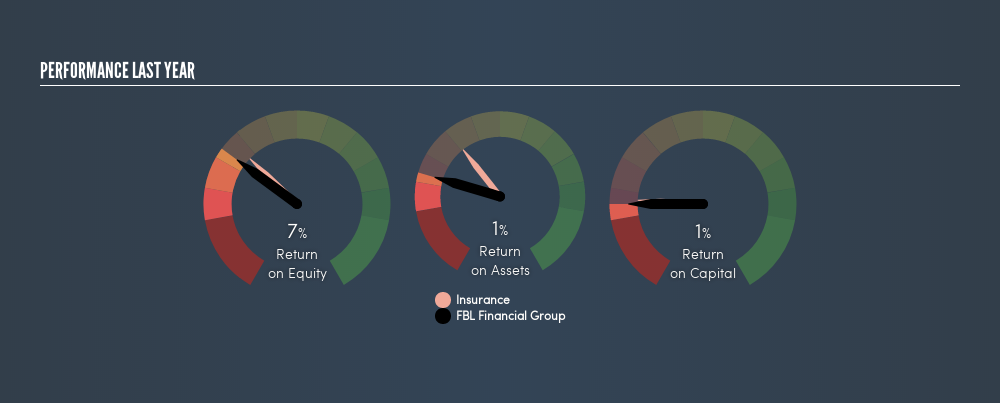
One simple way to determine if a company has a good return on equity is to compare it to the average for its industry. However, this method is only useful as a rough check, because companies do differ quite a bit within the same industry classification. The image below shows that FBL Financial Group has an ROE that is roughly in line with the Insurance industry average (8.6%).
That isn't amazing, but it is respectable. ROE doesn't tell us if the share price is low, but it can inform us to the nature of the business. For those looking for a bargain, other factors may be more important. If you like to buy stocks alongside management, then you might just love this free list of companies. (Hint: insiders have been buying them).
How Does Debt Impact Return On Equity?
Most companies need money -- from somewhere -- to grow their profits. That cash can come from issuing shares, retained earnings, or debt. In the first and second cases, the ROE will reflect this use of cash for investment in the business. In the latter case, the debt required for growth will boost returns, but will not impact the shareholders' equity. In this manner the use of debt will boost ROE, even though the core economics of the business stay the same.
FBL Financial Group's Debt And Its 7.4% ROE
FBL Financial Group has a debt to equity ratio of just 0.069, which is very low. I'm not impressed with its ROE, but the debt levels are not too high, indicating the business has decent prospects. Careful use of debt to boost returns is often very good for shareholders. However, it could reduce the company's ability to take advantage of future opportunities.
The Key Takeaway
Return on equity is one way we can compare the business quality of different companies. In my book the highest quality companies have high return on equity, despite low debt. If two companies have the same ROE, then I would generally prefer the one with less debt.
But ROE is just one piece of a bigger puzzle, since high quality businesses often trade on high multiples of earnings. Profit growth rates, versus the expectations reflected in the price of the stock, are a particularly important to consider. So I think it may be worth checking this free report on analyst forecasts for the company.
Of course, you might find a fantastic investment by looking elsewhere. So take a peek at this free list of interesting companies.
We aim to bring you long-term focused research analysis driven by fundamental data. Note that our analysis may not factor in the latest price-sensitive company announcements or qualitative material.
If you spot an error that warrants correction, please contact the editor at editorial-team@simplywallst.com. This article by Simply Wall St is general in nature. It does not constitute a recommendation to buy or sell any stock, and does not take account of your objectives, or your financial situation. Simply Wall St has no position in the stocks mentioned. Thank you for reading.
Market Insights


Advertisement
Community Narratives
For the Emperor: Why Games Workshop Could Be a Star Investment
Fair Value UK£160.00|0.4% overvalued
RO
Community Contributor
Securitas will boost margins with AI and tech-driven services
Fair Value SEK 260.91|44.5% undervalued
UN
Community Contributor
A Leader in EV Charging with Growth Potential
Fair Value €27.00|17.8% undervalued
TI
Community Contributor