Advertisement
Why SoftTech Engineers Limited’s (NSE:SOFTTECH) Return On Capital Employed Is Impressive
Today we are going to look at SoftTech Engineers Limited (NSE:SOFTTECH) to see whether it might be an attractive investment prospect. To be precise, we'll consider its Return On Capital Employed (ROCE), as that will inform our view of the quality of the business.
Firstly, we'll go over how we calculate ROCE. Next, we'll compare it to others in its industry. Last but not least, we'll look at what impact its current liabilities have on its ROCE.
Understanding Return On Capital Employed (ROCE)
ROCE is a measure of a company's yearly pre-tax profit (its return), relative to the capital employed in the business. Generally speaking a higher ROCE is better. Ultimately, it is a useful but imperfect metric. Author Edwin Whiting says to be careful when comparing the ROCE of different businesses, since 'No two businesses are exactly alike.
How Do You Calculate Return On Capital Employed?
The formula for calculating the return on capital employed is:
Return on Capital Employed = Earnings Before Interest and Tax (EBIT) ÷ (Total Assets - Current Liabilities)
Or for SoftTech Engineers:
0.14 = ₹91m ÷ (₹885m - ₹214m) (Based on the trailing twelve months to September 2019.)
Therefore, SoftTech Engineers has an ROCE of 14%.
Check out our latest analysis for SoftTech Engineers
Does SoftTech Engineers Have A Good ROCE?
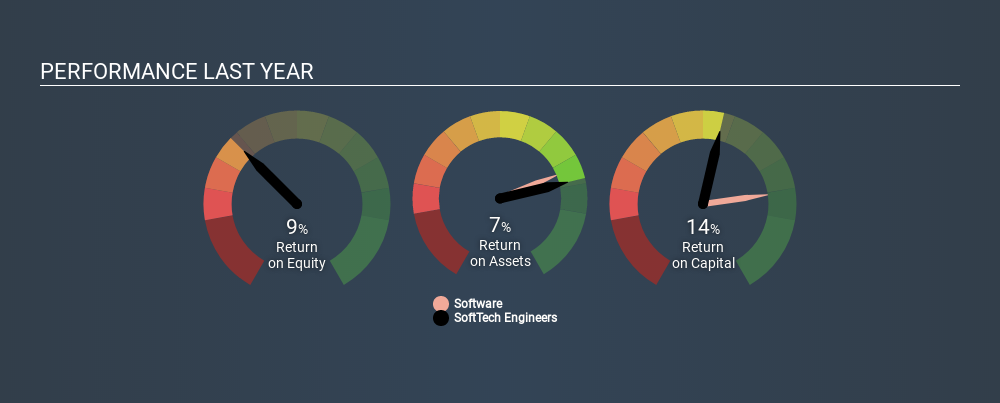
ROCE can be useful when making comparisons, such as between similar companies. Using our data, we find that SoftTech Engineers's ROCE is meaningfully better than the 11% average in the Software industry. We would consider this a positive, as it suggests it is using capital more effectively than other similar companies. Separate from how SoftTech Engineers stacks up against its industry, its ROCE in absolute terms is mediocre; relative to the returns on government bonds. It is possible that there are more rewarding investments out there.
SoftTech Engineers's current ROCE of 14% is lower than its ROCE in the past, which was 22%, 3 years ago. This makes us wonder if the business is facing new challenges. You can click on the image below to see (in greater detail) how SoftTech Engineers's past growth compares to other companies.
Remember that this metric is backwards looking - it shows what has happened in the past, and does not accurately predict the future. ROCE can be deceptive for cyclical businesses, as returns can look incredible in boom times, and terribly low in downturns. This is because ROCE only looks at one year, instead of considering returns across a whole cycle. If SoftTech Engineers is cyclical, it could make sense to check out this free graph of past earnings, revenue and cash flow.
How SoftTech Engineers's Current Liabilities Impact Its ROCE
Short term (or current) liabilities, are things like supplier invoices, overdrafts, or tax bills that need to be paid within 12 months. The ROCE equation subtracts current liabilities from capital employed, so a company with a lot of current liabilities appears to have less capital employed, and a higher ROCE than otherwise. To counter this, investors can check if a company has high current liabilities relative to total assets.
SoftTech Engineers has total assets of ₹885m and current liabilities of ₹214m. As a result, its current liabilities are equal to approximately 24% of its total assets. It is good to see a restrained amount of current liabilities, as this limits the effect on ROCE.
Our Take On SoftTech Engineers's ROCE
That said, SoftTech Engineers's ROCE is mediocre, there may be more attractive investments around. Of course, you might also be able to find a better stock than SoftTech Engineers. So you may wish to see this free collection of other companies that have grown earnings strongly.
I will like SoftTech Engineers better if I see some big insider buys. While we wait, check out this free list of growing companies with considerable, recent, insider buying.
If you spot an error that warrants correction, please contact the editor at editorial-team@simplywallst.com. This article by Simply Wall St is general in nature. It does not constitute a recommendation to buy or sell any stock, and does not take account of your objectives, or your financial situation. Simply Wall St has no position in the stocks mentioned.
We aim to bring you long-term focused research analysis driven by fundamental data. Note that our analysis may not factor in the latest price-sensitive company announcements or qualitative material. Thank you for reading.
About NSEI:SOFTTECH
SoftTech Engineers
Develops software products and solutions for the architecture, engineering, operations, and construction sectors in India and internationally.
Flawless balance sheet with low risk.
Similar Companies
Market Insights


Advertisement
Weekly Picks
JO


Jolt_Communications on ZenaTech ·
ZenaTech: A big bet on the rise of AI drones and drones-as-a-service
Fair Value:US$6.8569.9% undervalued
26 followersusers have followed this narrative
0 commentsusers have commented on this narrative
3 likesusers have liked this narrative
TR


tripledub on Intuit ·
A Wonderful Business at a Not-So-Wonderful Price
Fair Value:US$50016.7% undervalued
19 followersusers have followed this narrative
0 commentsusers have commented on this narrative
17 likesusers have liked this narrative
FA

FA_Trader on A1 A.K. Koh Group Berhad ·
A1 A.K. Koh Group Berhad: A simple local food story that could ride on Visit Malaysia 2026
Fair Value:RM 0.3343.9% undervalued
7 followersusers have followed this narrative
0 commentsusers have commented on this narrative
0 likesusers have liked this narrative
KA

kaladorm on American Integrity Insurance Group ·
Priced for worse weather, but undervalued even for a high hurricane season
Fair Value:US$37.1949.9% undervalued
10 followersusers have followed this narrative
0 commentsusers have commented on this narrative
3 likesusers have liked this narrative
Recently Updated Narratives
AN


andre_santos on Visa ·
Visa - A Fundamental and Historical Valuation
Fair Value:US$387.0723.7% undervalued
1 followerusers have followed this narrative
0 commentsusers have commented on this narrative
0 likesusers have liked this narrative
AG


Agricola on Central Asia Metals ·
A Case for Central Asia Metals to reach £15 by 2031 in a commodities bull market.
Fair Value:UK£1589.5% undervalued
1 followerusers have followed this narrative
0 commentsusers have commented on this narrative
0 likesusers have liked this narrative
RO


Robbo on Tesla ·
The academically fascinating Tesla
Fair Value:US$301.1k% overvalued
1 followerusers have followed this narrative
0 commentsusers have commented on this narrative
0 likesusers have liked this narrative
Popular Narratives
YA

Yang_ on SoFi Technologies ·
SoFi Technologies: The Apex Aggregator and the Infrastructure of the Modern Financial System
Fair Value:US$22.9833.7% undervalued
49 followersusers have followed this narrative
0 commentsusers have commented on this narrative
36 likesusers have liked this narrative
PD

pdixit1 on Vertiv Holdings Co ·
The Infrastructure AI Cannot Be Built Without
Fair Value:US$408.6438.6% undervalued
40 followersusers have followed this narrative
3 commentsusers have commented on this narrative
18 likesusers have liked this narrative
ZA

ZayaanS on Pro Medicus ·
Pro Medicus: The Market Is Confusing a Lumpy Quarter With a Broken Business
Fair Value:AU$196.7840.2% undervalued
33 followersusers have followed this narrative
7 commentsusers have commented on this narrative
21 likesusers have liked this narrative
Trending Discussion


DS

dsfaggafgafg on Micron Technology ·
This is truly one of the worst predictions of all time. Its forward PE is 3.9x.
0
|0