Advertisement
Why Powerful Technologies Limited’s (NSE:POWERFUL) Return On Capital Employed Looks Uninspiring
Want to participate in a short research study? Help shape the future of investing tools and you could win a $250 gift card!
Today we'll look at Powerful Technologies Limited (NSE:POWERFUL) and reflect on its potential as an investment. Specifically, we're going to calculate its Return On Capital Employed (ROCE), in the hopes of getting some insight into the business.
Firstly, we'll go over how we calculate ROCE. Then we'll compare its ROCE to similar companies. Last but not least, we'll look at what impact its current liabilities have on its ROCE.
What is Return On Capital Employed (ROCE)?
ROCE is a measure of a company's yearly pre-tax profit (its return), relative to the capital employed in the business. Generally speaking a higher ROCE is better. Ultimately, it is a useful but imperfect metric. Author Edwin Whiting says to be careful when comparing the ROCE of different businesses, since 'No two businesses are exactly alike.'
How Do You Calculate Return On Capital Employed?
The formula for calculating the return on capital employed is:
Return on Capital Employed = Earnings Before Interest and Tax (EBIT) ÷ (Total Assets - Current Liabilities)
Or for Powerful Technologies:
0.082 = ₹25m ÷ (₹505m - ₹206m) (Based on the trailing twelve months to March 2019.)
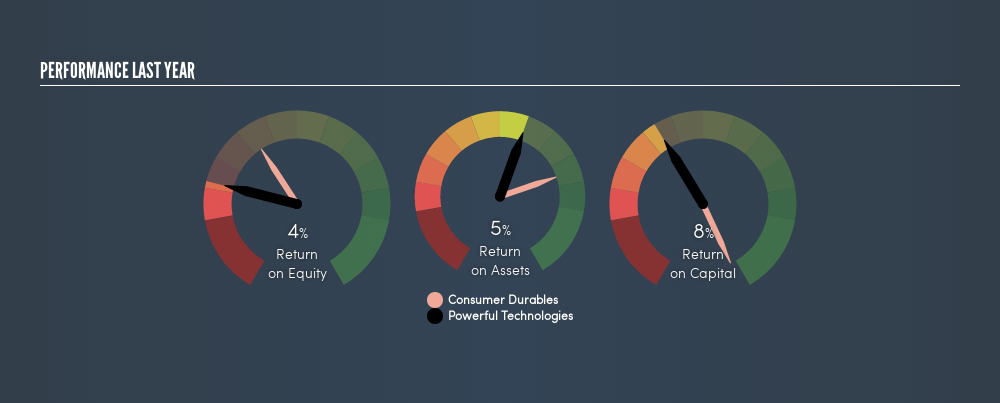
So, Powerful Technologies has an ROCE of 8.2%.
View our latest analysis for Powerful Technologies
Does Powerful Technologies Have A Good ROCE?
ROCE is commonly used for comparing the performance of similar businesses. In this analysis, Powerful Technologies's ROCE appears meaningfully below the 15% average reported by the Consumer Durables industry. This performance could be negative if sustained, as it suggests the business may underperform its industry. Regardless of how Powerful Technologies stacks up against its industry, its ROCE in absolute terms is quite low (especially compared to a bank account). There are potentially more appealing investments elsewhere.
Powerful Technologies's current ROCE of 8.2% is lower than its ROCE in the past, which was 52%, 3 years ago. So investors might consider if it has had issues recently.
Remember that this metric is backwards looking - it shows what has happened in the past, and does not accurately predict the future. Companies in cyclical industries can be difficult to understand using ROCE, as returns typically look high during boom times, and low during busts. ROCE is only a point-in-time measure. You can check if Powerful Technologies has cyclical profits by looking at this free graph of past earnings, revenue and cash flow.
How Powerful Technologies's Current Liabilities Impact Its ROCE
Liabilities, such as supplier bills and bank overdrafts, are referred to as current liabilities if they need to be paid within 12 months. Due to the way the ROCE equation works, having large bills due in the near term can make it look as though a company has less capital employed, and thus a higher ROCE than usual. To counteract this, we check if a company has high current liabilities, relative to its total assets.
Powerful Technologies has total liabilities of ₹206m and total assets of ₹505m. Therefore its current liabilities are equivalent to approximately 41% of its total assets. With a medium level of current liabilities boosting the ROCE a little, Powerful Technologies's low ROCE is unappealing.
Our Take On Powerful Technologies's ROCE
So researching other companies may be a better use of your time. You might be able to find a better investment than Powerful Technologies. If you want a selection of possible winners, check out this free list of interesting companies that trade on a P/E below 20 (but have proven they can grow earnings).
I will like Powerful Technologies better if I see some big insider buys. While we wait, check out this free list of growing companies with considerable, recent, insider buying.
We aim to bring you long-term focused research analysis driven by fundamental data. Note that our analysis may not factor in the latest price-sensitive company announcements or qualitative material.
If you spot an error that warrants correction, please contact the editor at editorial-team@simplywallst.com. This article by Simply Wall St is general in nature. It does not constitute a recommendation to buy or sell any stock, and does not take account of your objectives, or your financial situation. Simply Wall St has no position in the stocks mentioned. Thank you for reading.
Market Insights


Advertisement
Weekly Picks
LO


Lou_Basenese on Virtuix Holdings ·
From a “Shark Tank” Snub to an Air Force “Yes”: Why Virtuix at $3.50 May Be the Market’s Most Mispriced AI Story
Fair Value:US$7.559.3% undervalued
31 followersusers have followed this narrative
0 commentsusers have commented on this narrative
6 likesusers have liked this narrative
HE


HedgeY on IonQ ·
The Best-Funded Quantum Platform and Still a Stock Priced for Perfection
Fair Value:US$4811.0% overvalued
3 followersusers have followed this narrative
0 commentsusers have commented on this narrative
0 likesusers have liked this narrative
BL


BlackGoat on Cerebras Systems ·
The Wafer Giant Threatening NVIDIA's GPU Hegemony
Fair Value:US$415.5446.8% undervalued
9 followersusers have followed this narrative
1 commentusers have commented on this narrative
5 likesusers have liked this narrative
IV

Ivoed on Netflix ·
Netflix’s Business Quality Is Clear. The Harder Question Is Whether The Stock Is Still Cheap
Fair Value:US$8212.9% undervalued
5 followersusers have followed this narrative
0 commentsusers have commented on this narrative
2 likesusers have liked this narrative
Recently Updated Narratives
AN


andre_santos on NIKE ·
Nike - A Fundamental and Historical Valuation
Fair Value:US$36.8311.5% overvalued
10 followersusers have followed this narrative
0 commentsusers have commented on this narrative
0 likesusers have liked this narrative
TR


TripleS on AnaptysBio ·
ANAB has a scaling and rising royalty stream, one up and coming new royalty, a loan that dies in 2027 which will result in a doubling
Fair Value:US$9025.0% undervalued
1 followerusers have followed this narrative
0 commentsusers have commented on this narrative
0 likesusers have liked this narrative
GE
Germaine on MM Computer Systems Berhad ·
MM Computer Systems' Latest Contract Wins Reinforce Growth Momentum After Listing
Fair Value:RM 0.3313.6% undervalued
1 followerusers have followed this narrative
0 commentsusers have commented on this narrative
0 likesusers have liked this narrative
Popular Narratives
IN


Investingwilly on Mastercard ·
Mastercard: The Best Dividend Stock You're Ignoring
Fair Value:US$75031.5% undervalued
79 followersusers have followed this narrative
1 commentusers have commented on this narrative
9 likesusers have liked this narrative
HA


HarishPK on Adobe ·
Adobe: A Probabilistic Case for Undervaluation
Fair Value:US$319.9635.9% undervalued
62 followersusers have followed this narrative
9 commentsusers have commented on this narrative
19 likesusers have liked this narrative
MA


martinarauz on Nu Holdings ·
Investment Analysis (May 2026)
Fair Value:US$22.7441.2% undervalued
68 followersusers have followed this narrative
0 commentsusers have commented on this narrative
17 likesusers have liked this narrative

