
Advertisement
- Canada
- /
- Oil and Gas
- /
- TSX:CCO
Why Cameco Corporation’s (TSE:CCO) Use Of Investor Capital Doesn’t Look Great
Today we'll evaluate Cameco Corporation (TSE:CCO) to determine whether it could have potential as an investment idea. In particular, we'll consider its Return On Capital Employed (ROCE), as that can give us insight into how profitably the company is able to employ capital in its business.
Firstly, we'll go over how we calculate ROCE. Then we'll compare its ROCE to similar companies. Finally, we'll look at how its current liabilities affect its ROCE.
What is Return On Capital Employed (ROCE)?
ROCE measures the 'return' (pre-tax profit) a company generates from capital employed in its business. In general, businesses with a higher ROCE are usually better quality. Overall, it is a valuable metric that has its flaws. Renowned investment researcher Michael Mauboussin has suggested that a high ROCE can indicate that 'one dollar invested in the company generates value of more than one dollar'.
How Do You Calculate Return On Capital Employed?
The formula for calculating the return on capital employed is:
Return on Capital Employed = Earnings Before Interest and Tax (EBIT) ÷ (Total Assets - Current Liabilities)
Or for Cameco:
0.033 = CA$239m ÷ (CA$7.5b - CA$300m) (Based on the trailing twelve months to September 2019.)
Therefore, Cameco has an ROCE of 3.3%.
See our latest analysis for Cameco
Is Cameco's ROCE Good?
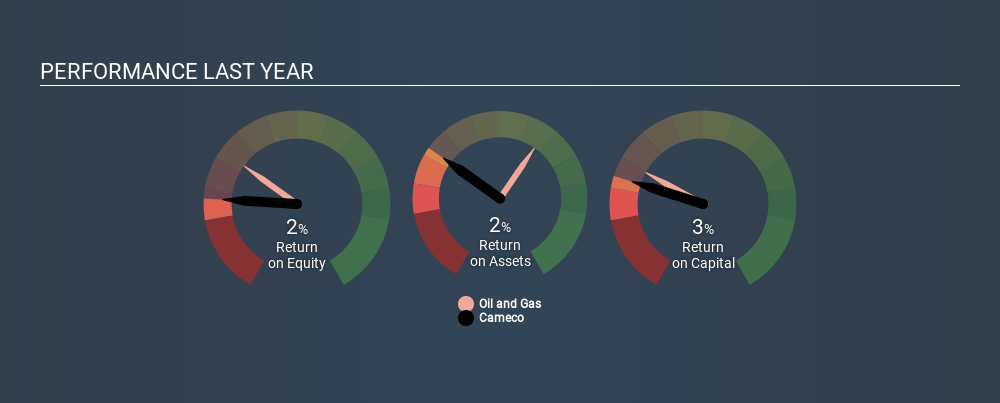
When making comparisons between similar businesses, investors may find ROCE useful. In this analysis, Cameco's ROCE appears meaningfully below the 5.4% average reported by the Oil and Gas industry. This performance could be negative if sustained, as it suggests the business may underperform its industry. Putting aside Cameco's performance relative to its industry, its ROCE in absolute terms is poor - considering the risk of owning stocks compared to government bonds. There are potentially more appealing investments elsewhere.
Cameco's current ROCE of 3.3% is lower than its ROCE in the past, which was 4.6%, 3 years ago. This makes us wonder if the business is facing new challenges. You can see in the image below how Cameco's ROCE compares to its industry. Click to see more on past growth.
Remember that this metric is backwards looking - it shows what has happened in the past, and does not accurately predict the future. ROCE can be misleading for companies in cyclical industries, with returns looking impressive during the boom times, but very weak during the busts. ROCE is, after all, simply a snap shot of a single year. Remember that most companies like Cameco are cyclical businesses. What happens in the future is pretty important for investors, so we have prepared a free report on analyst forecasts for Cameco.
How Cameco's Current Liabilities Impact Its ROCE
Liabilities, such as supplier bills and bank overdrafts, are referred to as current liabilities if they need to be paid within 12 months. The ROCE equation subtracts current liabilities from capital employed, so a company with a lot of current liabilities appears to have less capital employed, and a higher ROCE than otherwise. To counteract this, we check if a company has high current liabilities, relative to its total assets.
Cameco has total assets of CA$7.5b and current liabilities of CA$300m. Therefore its current liabilities are equivalent to approximately 4.0% of its total assets. Cameco has very few current liabilities, which have a minimal effect on its already low ROCE.
Our Take On Cameco's ROCE
Still, investors could probably find more attractive prospects with better performance out there. Of course, you might find a fantastic investment by looking at a few good candidates. So take a peek at this free list of companies with modest (or no) debt, trading on a P/E below 20.
If you like to buy stocks alongside management, then you might just love this free list of companies. (Hint: insiders have been buying them).
If you spot an error that warrants correction, please contact the editor at editorial-team@simplywallst.com. This article by Simply Wall St is general in nature. It does not constitute a recommendation to buy or sell any stock, and does not take account of your objectives, or your financial situation. Simply Wall St has no position in the stocks mentioned.
We aim to bring you long-term focused research analysis driven by fundamental data. Note that our analysis may not factor in the latest price-sensitive company announcements or qualitative material. Thank you for reading.
About TSX:CCO
Excellent balance sheet with reasonable growth potential.
Similar Companies
Market Insights


Advertisement
Community Narratives
For the Emperor: Why Games Workshop Could Be a Star Investment
Fair Value UK£160.00|0.1% overvalued
RO
Community Contributor
Securitas will boost margins with AI and tech-driven services
Fair Value SEK 260.91|44.5% undervalued
UN
Community Contributor
A Leader in EV Charging with Growth Potential
Fair Value €27.00|20.9% undervalued
TI
Community Contributor