Advertisement
- United States
- /
- Tech Hardware
- /
- NasdaqGS:AAPL
Where Apple Inc.'s (NASDAQ:AAPL) Earnings Growth Stands Against Its Industry
When Apple Inc. (NasdaqGS:AAPL) announced its most recent earnings (28 September 2019), I compared it against two factor: its historical earnings track record, and the performance of its industry peers on average. Being able to interpret how well Apple has done so far requires weighing its performance against a benchmark, rather than looking at a standalone number at a point in time. In this article, I've summarized the key takeaways on how I see AAPL has performed.
See our latest analysis for Apple
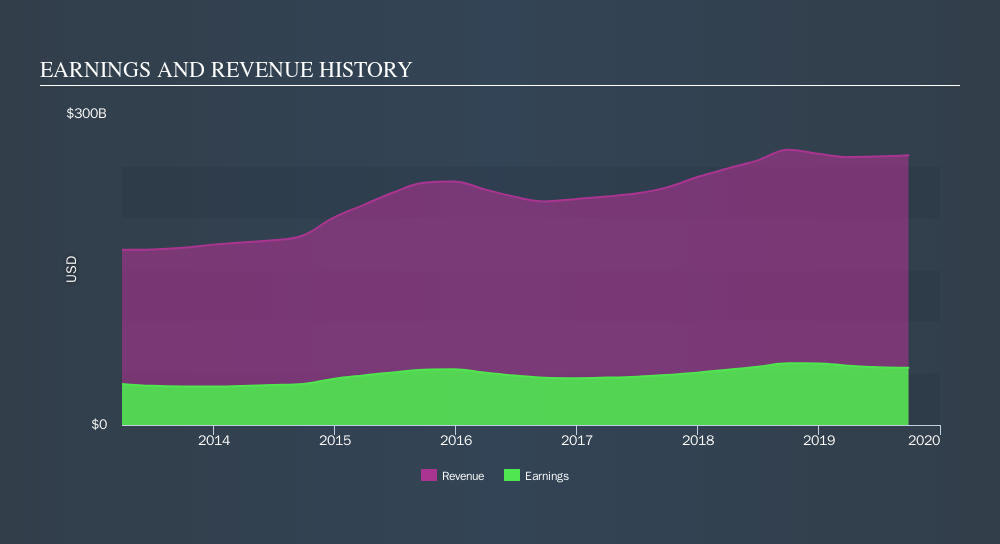
How Well Did AAPL Perform?
AAPL's trailing twelve-month earnings (from 28 September 2019) of US$55b has declined by -7.1% compared to the previous year.
Furthermore, this one-year growth rate has been lower than its average earnings growth rate over the past 5 years of 4.8%, indicating the rate at which AAPL is growing has slowed down. Why is this? Well, let’s take a look at what’s going on with margins and whether the rest of the industry is experiencing the hit as well.
In terms of returns from investment, Apple has invested its equity funds well leading to a 61% return on equity (ROE), above the sensible minimum of 20%. Furthermore, its return on assets (ROA) of 16% exceeds the US Tech industry of 4.7%, indicating Apple has used its assets more efficiently. And finally, its return on capital (ROC), which also accounts for Apple’s debt level, has increased over the past 3 years from 25% to 27%.
What does this mean?
Apple's track record can be a valuable insight into its earnings performance, but it certainly doesn't tell the whole story. Companies that are profitable, but have unpredictable earnings, can have many factors influencing its business. I suggest you continue to research Apple to get a better picture of the stock by looking at:
- Future Outlook: What are well-informed industry analysts predicting for AAPL’s future growth? Take a look at our free research report of analyst consensus for AAPL’s outlook.
- Financial Health: Are AAPL’s operations financially sustainable? Balance sheets can be hard to analyze, which is why we’ve done it for you. Check out our financial health checks here.
- Other High-Performing Stocks: Are there other stocks that provide better prospects with proven track records? Explore our free list of these great stocks here.
NB: Figures in this article are calculated using data from the trailing twelve months from 28 September 2019. This may not be consistent with full year annual report figures.
If you spot an error that warrants correction, please contact the editor at editorial-team@simplywallst.com. This article by Simply Wall St is general in nature. It does not constitute a recommendation to buy or sell any stock, and does not take account of your objectives, or your financial situation. Simply Wall St has no position in the stocks mentioned.
We aim to bring you long-term focused research analysis driven by fundamental data. Note that our analysis may not factor in the latest price-sensitive company announcements or qualitative material. Thank you for reading.
About NasdaqGS:AAPL
Apple
Designs, manufactures, and markets smartphones, personal computers, tablets, wearables, and accessories worldwide.
Outstanding track record with excellent balance sheet.
Similar Companies
Market Insights


Advertisement
Weekly Picks
CE


Ceazar on Sparc AI ·
When GPS fails: this small cap is fixing a $54B drone problem
Fair Value:CA$5.2542.9% undervalued
65 followersusers have followed this narrative
0 commentsusers have commented on this narrative
17 likesusers have liked this narrative
HE


HedgeY on IonQ ·
The Best-Funded Quantum Platform and Still a Stock Priced for Perfection
Fair Value:US$487.1% overvalued
27 followersusers have followed this narrative
0 commentsusers have commented on this narrative
7 likesusers have liked this narrative
BL


BlackGoat on Cerebras Systems ·
The Wafer Giant Threatening NVIDIA's GPU Hegemony
Fair Value:US$415.5446.8% undervalued
50 followersusers have followed this narrative
1 commentusers have commented on this narrative
7 likesusers have liked this narrative
IV

Ivoed on Netflix ·
Netflix’s Business Quality Is Clear. The Harder Question Is Whether The Stock Is Still Cheap
Fair Value:US$829.5% undervalued
26 followersusers have followed this narrative
2 commentsusers have commented on this narrative
8 likesusers have liked this narrative
Recently Updated Narratives
HM

Hmdlsk on Circus ·
Circus SE's AI-driven food systems will augment global food service
Fair Value:€3082.3% undervalued
7 followersusers have followed this narrative
0 commentsusers have commented on this narrative
0 likesusers have liked this narrative
BR

Bravosatya on Meta Platforms ·
Meta Platforms - Zuckerberg’s investment decisions are impulsive or Prudent?
Fair Value:US$730.0216.0% undervalued
3 followersusers have followed this narrative
0 commentsusers have commented on this narrative
0 likesusers have liked this narrative
JU

julio on FIGS ·
Figs valuation
Fair Value:US$14.3930.2% undervalued
21 followersusers have followed this narrative
6 commentsusers have commented on this narrative
0 likesusers have liked this narrative
Popular Narratives
IN


Investingwilly on Mastercard ·
Mastercard: The Best Dividend Stock You're Ignoring
Fair Value:US$75030.3% undervalued
80 followersusers have followed this narrative
1 commentusers have commented on this narrative
9 likesusers have liked this narrative
HA


HarishPK on Adobe ·
Adobe: A Probabilistic Case for Undervaluation
Fair Value:US$319.9634.1% undervalued
62 followersusers have followed this narrative
9 commentsusers have commented on this narrative
19 likesusers have liked this narrative
MA


martinarauz on Nu Holdings ·
Investment Analysis (May 2026)
Fair Value:US$22.7441.1% undervalued
68 followersusers have followed this narrative
0 commentsusers have commented on this narrative
17 likesusers have liked this narrative

