
Advertisement
- United States
- /
- Consumer Durables
- /
- NYSE:TPH
What Is TRI Pointe Group's (NYSE:TPH) P/E Ratio After Its Share Price Rocketed?

Those holding TRI Pointe Group (NYSE:TPH) shares must be pleased that the share price has rebounded 47% in the last thirty days. But unfortunately, the stock is still down by 38% over a quarter. But shareholders may not all be feeling jubilant, since the share price is still down 26% in the last year.
Assuming no other changes, a sharply higher share price makes a stock less attractive to potential buyers. While the market sentiment towards a stock is very changeable, in the long run, the share price will tend to move in the same direction as earnings per share. So some would prefer to hold off buying when there is a lot of optimism towards a stock. One way to gauge market expectations of a stock is to look at its Price to Earnings Ratio (PE Ratio). A high P/E ratio means that investors have a high expectation about future growth, while a low P/E ratio means they have low expectations about future growth.
Check out our latest analysis for TRI Pointe Group
How Does TRI Pointe Group's P/E Ratio Compare To Its Peers?
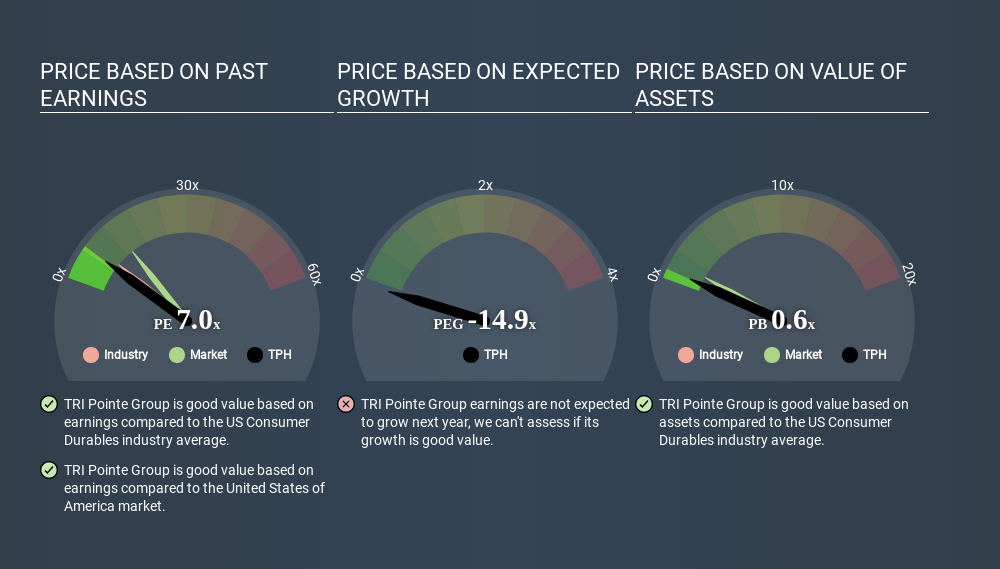
TRI Pointe Group's P/E of 6.99 indicates relatively low sentiment towards the stock. If you look at the image below, you can see TRI Pointe Group has a lower P/E than the average (8.4) in the consumer durables industry classification.
TRI Pointe Group's P/E tells us that market participants think it will not fare as well as its peers in the same industry. While current expectations are low, the stock could be undervalued if the situation is better than the market assumes. You should delve deeper. I like to check if company insiders have been buying or selling.
How Growth Rates Impact P/E Ratios
Probably the most important factor in determining what P/E a company trades on is the earnings growth. If earnings are growing quickly, then the 'E' in the equation will increase faster than it would otherwise. And in that case, the P/E ratio itself will drop rather quickly. A lower P/E should indicate the stock is cheap relative to others -- and that may attract buyers.
TRI Pointe Group shrunk earnings per share by 19% over the last year. But EPS is up 20% over the last 5 years.
Remember: P/E Ratios Don't Consider The Balance Sheet
It's important to note that the P/E ratio considers the market capitalization, not the enterprise value. That means it doesn't take debt or cash into account. Theoretically, a business can improve its earnings (and produce a lower P/E in the future) by investing in growth. That means taking on debt (or spending its cash).
Spending on growth might be good or bad a few years later, but the point is that the P/E ratio does not account for the option (or lack thereof).
So What Does TRI Pointe Group's Balance Sheet Tell Us?
Net debt totals 69% of TRI Pointe Group's market cap. If you want to compare its P/E ratio to other companies, you should absolutely keep in mind it has significant borrowings.
The Verdict On TRI Pointe Group's P/E Ratio
TRI Pointe Group trades on a P/E ratio of 7.0, which is below the US market average of 13.6. The P/E reflects market pessimism that probably arises from the lack of recent EPS growth, paired with significant leverage. What is very clear is that the market has become less pessimistic about TRI Pointe Group over the last month, with the P/E ratio rising from 4.7 back then to 7.0 today. For those who like to invest in turnarounds, that might mean it's time to put the stock on a watchlist, or research it. But others might consider the opportunity to have passed.
Investors should be looking to buy stocks that the market is wrong about. If it is underestimating a company, investors can make money by buying and holding the shares until the market corrects itself. So this free visualization of the analyst consensus on future earnings could help you make the right decision about whether to buy, sell, or hold.
Of course, you might find a fantastic investment by looking at a few good candidates. So take a peek at this free list of companies with modest (or no) debt, trading on a P/E below 20.
If you spot an error that warrants correction, please contact the editor at editorial-team@simplywallst.com. This article by Simply Wall St is general in nature. It does not constitute a recommendation to buy or sell any stock, and does not take account of your objectives, or your financial situation. Simply Wall St has no position in the stocks mentioned.
We aim to bring you long-term focused research analysis driven by fundamental data. Note that our analysis may not factor in the latest price-sensitive company announcements or qualitative material. Thank you for reading.
About NYSE:TPH
Tri Pointe Homes
Engages in the design, construction, and sale of single-family attached and detached homes in the United States.
Solid track record with excellent balance sheet.
Similar Companies
Market Insights


Advertisement
Community Narratives
The Future of Drug Testing? Fingerprint Tech Shows Serious Promise
Fair Value US$2.98|40.3% undervalued
JO
Community Contributor
Suncorp’s Next Chapter: Insurance-Only and Ready to Grow
Fair Value AU$22.83|7.9% undervalued
RO
Community Contributor
Thyssenkrupp Nucera Will Achieve Double-Digit Profits by 2030 Boosted by Hydrogen Growth
Fair Value €14.40|31.6% undervalued
CH
Community Contributor
Tesla’s Nvidia Moment – The AI & Robotics Inflection Point
Fair Value US$359.72|12.3% undervalued
BL
Community Contributor