
Advertisement
- India
- /
- Hospitality
- /
- NSEI:TAJGVK
What Is TAJGVK Hotels & Resorts's (NSE:TAJGVK) P/E Ratio After Its Share Price Tanked?
To the annoyance of some shareholders, TAJGVK Hotels & Resorts (NSE:TAJGVK) shares are down a considerable 33% in the last month. That drop has capped off a tough year for shareholders, with the share price down 41% in that time.
All else being equal, a share price drop should make a stock more attractive to potential investors. While the market sentiment towards a stock is very changeable, in the long run, the share price will tend to move in the same direction as earnings per share. So, on certain occasions, long term focussed investors try to take advantage of pessimistic expectations to buy shares at a better price. One way to gauge market expectations of a stock is to look at its Price to Earnings Ratio (PE Ratio). A high P/E implies that investors have high expectations of what a company can achieve compared to a company with a low P/E ratio.
Check out our latest analysis for TAJGVK Hotels & Resorts
Does TAJGVK Hotels & Resorts Have A Relatively High Or Low P/E For Its Industry?
We can tell from its P/E ratio of 26.5 that there is some investor optimism about TAJGVK Hotels & Resorts. As you can see below, TAJGVK Hotels & Resorts has a higher P/E than the average company (19.9) in the hospitality industry.
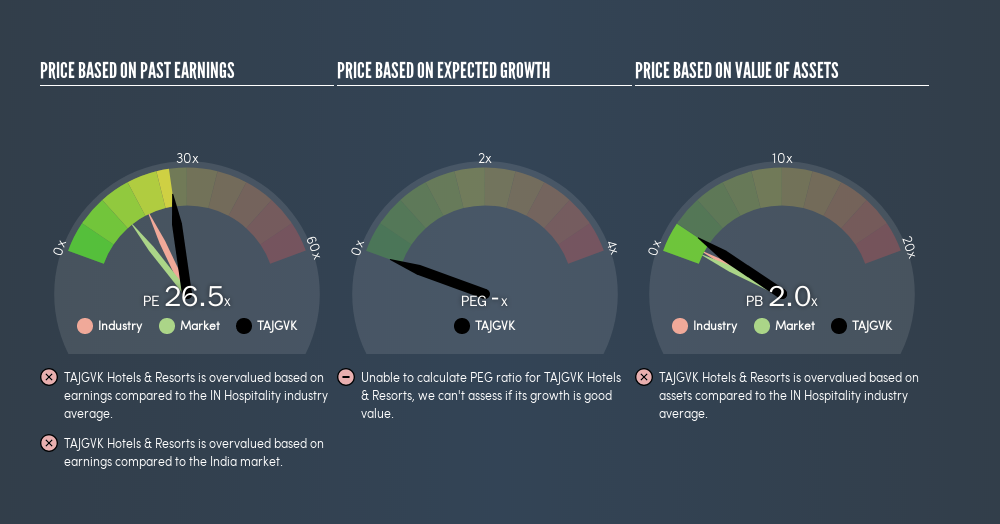
Its relatively high P/E ratio indicates that TAJGVK Hotels & Resorts shareholders think it will perform better than other companies in its industry classification.
How Growth Rates Impact P/E Ratios
Earnings growth rates have a big influence on P/E ratios. Earnings growth means that in the future the 'E' will be higher. That means even if the current P/E is high, it will reduce over time if the share price stays flat. A lower P/E should indicate the stock is cheap relative to others -- and that may attract buyers.
Most would be impressed by TAJGVK Hotels & Resorts earnings growth of 17% in the last year. And its annual EPS growth rate over 5 years is 59%. So one might expect an above average P/E ratio.
Remember: P/E Ratios Don't Consider The Balance Sheet
Don't forget that the P/E ratio considers market capitalization. So it won't reflect the advantage of cash, or disadvantage of debt. The exact same company would hypothetically deserve a higher P/E ratio if it had a strong balance sheet, than if it had a weak one with lots of debt, because a cashed up company can spend on growth.
Spending on growth might be good or bad a few years later, but the point is that the P/E ratio does not account for the option (or lack thereof).
So What Does TAJGVK Hotels & Resorts's Balance Sheet Tell Us?
TAJGVK Hotels & Resorts's net debt is 24% of its market cap. It would probably deserve a higher P/E ratio if it was net cash, since it would have more options for growth.
The Verdict On TAJGVK Hotels & Resorts's P/E Ratio
TAJGVK Hotels & Resorts has a P/E of 26.5. That's higher than the average in its market, which is 13.5. Its debt levels do not imperil its balance sheet and it is growing EPS strongly. So on this analysis it seems reasonable that its P/E ratio is above average. Given TAJGVK Hotels & Resorts's P/E ratio has declined from 39.7 to 26.5 in the last month, we know for sure that the market is significantly less confident about the business today, than it was back then. For those who prefer to invest with the flow of momentum, that might be a bad sign, but for a contrarian, it may signal opportunity.
Investors should be looking to buy stocks that the market is wrong about. If the reality for a company is better than it expects, you can make money by buying and holding for the long term. So this free visual report on analyst forecasts could hold the key to an excellent investment decision.
But note: TAJGVK Hotels & Resorts may not be the best stock to buy. So take a peek at this free list of interesting companies with strong recent earnings growth (and a P/E ratio below 20).
We aim to bring you long-term focused research analysis driven by fundamental data. Note that our analysis may not factor in the latest price-sensitive company announcements or qualitative material.
If you spot an error that warrants correction, please contact the editor at editorial-team@simplywallst.com. This article by Simply Wall St is general in nature. It does not constitute a recommendation to buy or sell any stock, and does not take account of your objectives, or your financial situation. Simply Wall St has no position in the stocks mentioned. Thank you for reading.
About NSEI:TAJGVK
TAJGVK Hotels & Resorts
Owns, operates, and manages hotels, palaces, and resorts under the TAJ brand in India.
Flawless balance sheet with acceptable track record.
Similar Companies
Market Insights

Advertisement
Community Narratives
MINISO's fair value is projected at 26.69 with an anticipated PE ratio shift of 20x
Fair Value US$24.03|11.0% undervalued
BE
Community Contributor
Procter & Gamble: A Dividend Giant Facing Slowing Growth
Fair Value US$119.81|23.3% overvalued
AN
Community Contributor
Eli Lilly's Future Growth Driven by Tirzepatide and Favorable Market Conditions
Fair Value US$1.19k|13.8% undervalued
EA
Community Contributor