
Advertisement
- Hong Kong
- /
- Semiconductors
- /
- SEHK:1665
What Is Pentamaster International's (HKG:1665) P/E Ratio After Its Share Price Rocketed?

Pentamaster International (HKG:1665) shares have continued recent momentum with a 36% gain in the last month alone. That brought the twelve month gain to a very sharp 58%.
All else being equal, a sharp share price increase should make a stock less attractive to potential investors. While the market sentiment towards a stock is very changeable, in the long run, the share price will tend to move in the same direction as earnings per share. So some would prefer to hold off buying when there is a lot of optimism towards a stock. Perhaps the simplest way to get a read on investors' expectations of a business is to look at its Price to Earnings Ratio (PE Ratio). Investors have optimistic expectations of companies with higher P/E ratios, compared to companies with lower P/E ratios.
See our latest analysis for Pentamaster International
How Does Pentamaster International's P/E Ratio Compare To Its Peers?
Pentamaster International has a P/E ratio of 13.69. As you can see below Pentamaster International has a P/E ratio that is fairly close for the average for the semiconductor industry, which is 14.0.
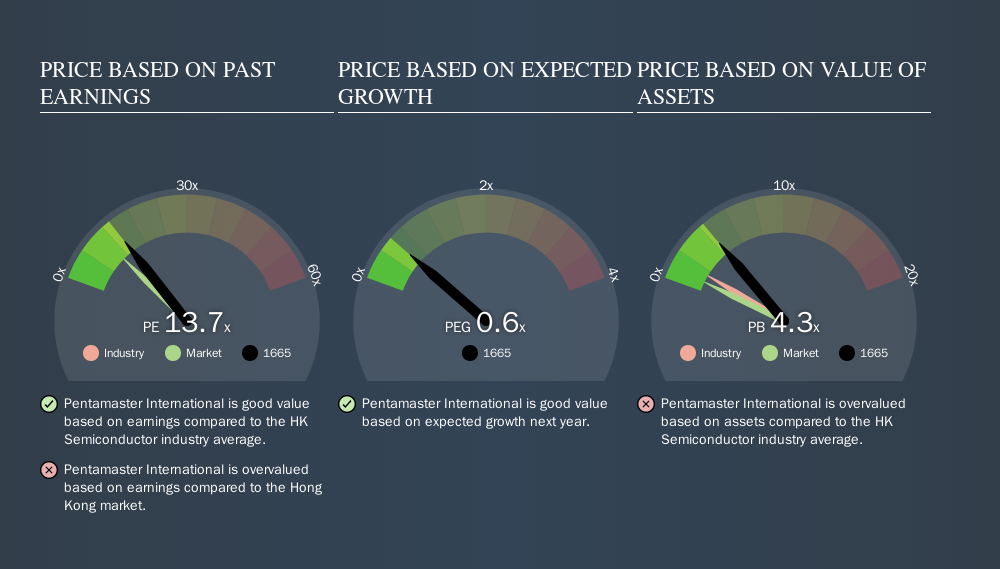
Pentamaster International's P/E tells us that market participants think its prospects are roughly in line with its industry.
How Growth Rates Impact P/E Ratios
P/E ratios primarily reflect market expectations around earnings growth rates. When earnings grow, the 'E' increases, over time. That means unless the share price increases, the P/E will reduce in a few years. And as that P/E ratio drops, the company will look cheap, unless its share price increases.
Pentamaster International's earnings made like a rocket, taking off 63% last year. So if Pentamaster International grows EPS going forward, that should be a positive for the share price. I would further inform my view by checking insider buying and selling., among other things.
Remember: P/E Ratios Don't Consider The Balance Sheet
The 'Price' in P/E reflects the market capitalization of the company. In other words, it does not consider any debt or cash that the company may have on the balance sheet. The exact same company would hypothetically deserve a higher P/E ratio if it had a strong balance sheet, than if it had a weak one with lots of debt, because a cashed up company can spend on growth.
Such expenditure might be good or bad, in the long term, but the point here is that the balance sheet is not reflected by this ratio.
How Does Pentamaster International's Debt Impact Its P/E Ratio?
Pentamaster International has net cash of RM286m. This is fairly high at 18% of its market capitalization. That might mean balance sheet strength is important to the business, but should also help push the P/E a bit higher than it would otherwise be.
The Verdict On Pentamaster International's P/E Ratio
Pentamaster International's P/E is 13.7 which is above average (10.5) in its market. The excess cash it carries is the gravy on top its fast EPS growth. So based on this analysis we'd expect Pentamaster International to have a high P/E ratio. What we know for sure is that investors have become more excited about Pentamaster International recently, since they have pushed its P/E ratio from 10.1 to 13.7 over the last month. For those who prefer to invest with the flow of momentum, that might mean it's time to put the stock on a watchlist, or research it. But the contrarian may see it as a missed opportunity.
Investors have an opportunity when market expectations about a stock are wrong. If the reality for a company is better than it expects, you can make money by buying and holding for the long term. So this free visualization of the analyst consensus on future earnings could help you make the right decision about whether to buy, sell, or hold.
You might be able to find a better buy than Pentamaster International. If you want a selection of possible winners, check out this free list of interesting companies that trade on a P/E below 20 (but have proven they can grow earnings).
We aim to bring you long-term focused research analysis driven by fundamental data. Note that our analysis may not factor in the latest price-sensitive company announcements or qualitative material.
If you spot an error that warrants correction, please contact the editor at editorial-team@simplywallst.com. This article by Simply Wall St is general in nature. It does not constitute a recommendation to buy or sell any stock, and does not take account of your objectives, or your financial situation. Simply Wall St has no position in the stocks mentioned. Thank you for reading.
About SEHK:1665
Pentamaster International
An investment holding company, provides automation manufacturing and technology solutions in Malaysia and internationally.
Flawless balance sheet with reasonable growth potential.
Market Insights


Advertisement
Community Narratives
The Future of Drug Testing? Fingerprint Tech Shows Serious Promise
Fair Value US$2.98|40.3% undervalued
JO
Community Contributor
Suncorp’s Next Chapter: Insurance-Only and Ready to Grow
Fair Value AU$22.83|7.6% undervalued
RO
Community Contributor
Thyssenkrupp Nucera Will Achieve Double-Digit Profits by 2030 Boosted by Hydrogen Growth
Fair Value €14.40|31.6% undervalued
CH
Community Contributor
Tesla’s Nvidia Moment – The AI & Robotics Inflection Point
Fair Value US$359.72|12.3% undervalued
BL
Community Contributor