
Advertisement
What Is Music Broadcast's (NSE:RADIOCITY) P/E Ratio After Its Share Price Tanked?
Unfortunately for some shareholders, the Music Broadcast (NSE:RADIOCITY) share price has dived 30% in the last thirty days. That drop has capped off a tough year for shareholders, with the share price down 46% in that time.
Assuming nothing else has changed, a lower share price makes a stock more attractive to potential buyers. While the market sentiment towards a stock is very changeable, in the long run, the share price will tend to move in the same direction as earnings per share. So, on certain occasions, long term focussed investors try to take advantage of pessimistic expectations to buy shares at a better price. Perhaps the simplest way to get a read on investors' expectations of a business is to look at its Price to Earnings Ratio (PE Ratio). A high P/E implies that investors have high expectations of what a company can achieve compared to a company with a low P/E ratio.
View our latest analysis for Music Broadcast
Does Music Broadcast Have A Relatively High Or Low P/E For Its Industry?
Music Broadcast's P/E of 17.91 indicates some degree of optimism towards the stock. You can see in the image below that the average P/E (12.3) for companies in the media industry is lower than Music Broadcast's P/E.
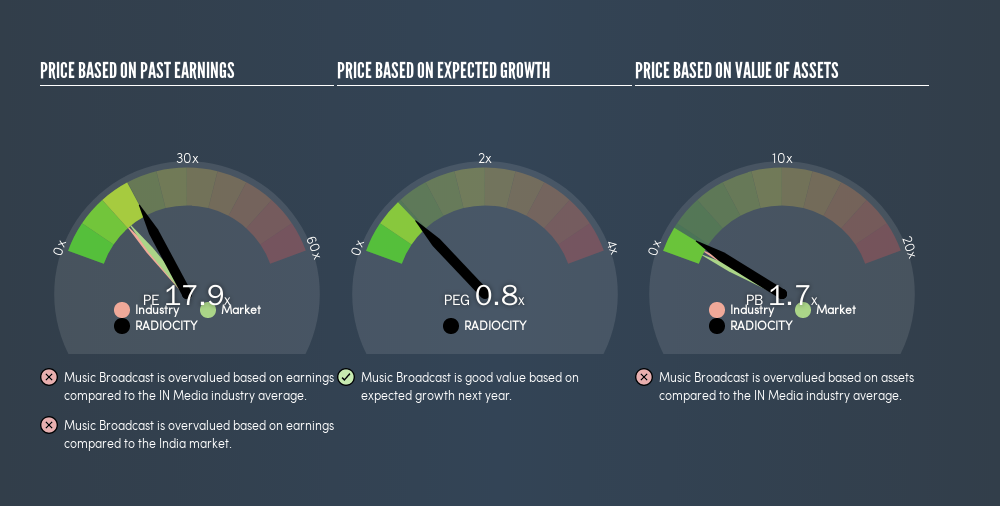
Its relatively high P/E ratio indicates that Music Broadcast shareholders think it will perform better than other companies in its industry classification.
How Growth Rates Impact P/E Ratios
Companies that shrink earnings per share quickly will rapidly decrease the 'E' in the equation. That means unless the share price falls, the P/E will increase in a few years. Then, a higher P/E might scare off shareholders, pushing the share price down.
Music Broadcast saw earnings per share improve by -6.0% last year. And its annual EPS growth rate over 5 years is 9.7%. Unfortunately, earnings per share are down 5.9% a year, over 3 years.
A Limitation: P/E Ratios Ignore Debt and Cash In The Bank
One drawback of using a P/E ratio is that it considers market capitalization, but not the balance sheet. That means it doesn't take debt or cash into account. The exact same company would hypothetically deserve a higher P/E ratio if it had a strong balance sheet, than if it had a weak one with lots of debt, because a cashed up company can spend on growth.
Such expenditure might be good or bad, in the long term, but the point here is that the balance sheet is not reflected by this ratio.
Is Debt Impacting Music Broadcast's P/E?
Music Broadcast has net cash of ₹2.3b. This is fairly high at 23% of its market capitalization. That might mean balance sheet strength is important to the business, but should also help push the P/E a bit higher than it would otherwise be.
The Bottom Line On Music Broadcast's P/E Ratio
Music Broadcast trades on a P/E ratio of 17.9, which is above its market average of 13.1. EPS was up modestly better over the last twelve months. And the net cash position provides the company with multiple options. The high P/E suggests the market thinks further growth will come. Given Music Broadcast's P/E ratio has declined from 25.7 to 17.9 in the last month, we know for sure that the market is significantly less confident about the business today, than it was back then. For those who don't like to trade against momentum, that could be a warning sign, but a contrarian investor might want to take a closer look.
Investors should be looking to buy stocks that the market is wrong about. If the reality for a company is better than it expects, you can make money by buying and holding for the long term. So this free report on the analyst consensus forecasts could help you make a master move on this stock.
Of course, you might find a fantastic investment by looking at a few good candidates. So take a peek at this free list of companies with modest (or no) debt, trading on a P/E below 20.
We aim to bring you long-term focused research analysis driven by fundamental data. Note that our analysis may not factor in the latest price-sensitive company announcements or qualitative material.
If you spot an error that warrants correction, please contact the editor at editorial-team@simplywallst.com. This article by Simply Wall St is general in nature. It does not constitute a recommendation to buy or sell any stock, and does not take account of your objectives, or your financial situation. Simply Wall St has no position in the stocks mentioned. Thank you for reading.
About NSEI:RADIOCITY
Music Broadcast
Engages in the operating of FM radio stations under the Radio City brand name in India.
Mediocre balance sheet and slightly overvalued.
Market Insights


Advertisement
Community Narratives
For the Emperor: Why Games Workshop Could Be a Star Investment
Fair Value UK£160.00|0.4% overvalued
RO
Community Contributor
Securitas will boost margins with AI and tech-driven services
Fair Value SEK 260.91|44.5% undervalued
UN
Community Contributor
A Leader in EV Charging with Growth Potential
Fair Value €27.00|17.8% undervalued
TI
Community Contributor