
Advertisement
What Is Lypsa Gems & Jewellery's (NSE:LYPSAGEMS) P/E Ratio After Its Share Price Rocketed?

Lypsa Gems & Jewellery (NSE:LYPSAGEMS) shares have had a really impressive month, gaining 36%, after some slippage. But shareholders may not all be feeling jubilant, since the share price is still down 41% in the last year.
All else being equal, a sharp share price increase should make a stock less attractive to potential investors. While the market sentiment towards a stock is very changeable, in the long run, the share price will tend to move in the same direction as earnings per share. So some would prefer to hold off buying when there is a lot of optimism towards a stock. One way to gauge market expectations of a stock is to look at its Price to Earnings Ratio (PE Ratio). Investors have optimistic expectations of companies with higher P/E ratios, compared to companies with lower P/E ratios.
View our latest analysis for Lypsa Gems & Jewellery
Does Lypsa Gems & Jewellery Have A Relatively High Or Low P/E For Its Industry?
Lypsa Gems & Jewellery's P/E of 2.57 indicates relatively low sentiment towards the stock. The image below shows that Lypsa Gems & Jewellery has a lower P/E than the average (11.3) P/E for companies in the luxury industry.
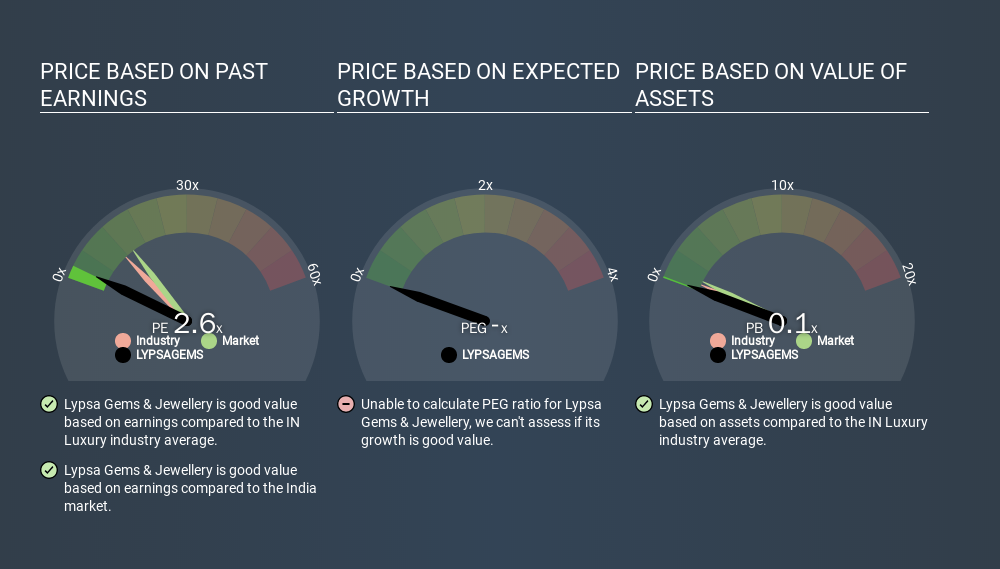
Its relatively low P/E ratio indicates that Lypsa Gems & Jewellery shareholders think it will struggle to do as well as other companies in its industry classification. Many investors like to buy stocks when the market is pessimistic about their prospects. You should delve deeper. I like to check if company insiders have been buying or selling.
How Growth Rates Impact P/E Ratios
When earnings fall, the 'E' decreases, over time. That means unless the share price falls, the P/E will increase in a few years. Then, a higher P/E might scare off shareholders, pushing the share price down.
Lypsa Gems & Jewellery saw earnings per share decrease by 75% last year. And over the longer term (5 years) earnings per share have decreased 14% annually. This growth rate might warrant a below average P/E ratio.
Remember: P/E Ratios Don't Consider The Balance Sheet
Don't forget that the P/E ratio considers market capitalization. That means it doesn't take debt or cash into account. The exact same company would hypothetically deserve a higher P/E ratio if it had a strong balance sheet, than if it had a weak one with lots of debt, because a cashed up company can spend on growth.
Such spending might be good or bad, overall, but the key point here is that you need to look at debt to understand the P/E ratio in context.
So What Does Lypsa Gems & Jewellery's Balance Sheet Tell Us?
Net debt totals a substantial 161% of Lypsa Gems & Jewellery's market cap. This is a relatively high level of debt, so the stock probably deserves a relatively low P/E ratio. Keep that in mind when comparing it to other companies.
The Verdict On Lypsa Gems & Jewellery's P/E Ratio
Lypsa Gems & Jewellery trades on a P/E ratio of 2.6, which is below the IN market average of 14.0. The P/E reflects market pessimism that probably arises from the lack of recent EPS growth, paired with significant leverage. What is very clear is that the market has become less pessimistic about Lypsa Gems & Jewellery over the last month, with the P/E ratio rising from 1.9 back then to 2.6 today. For those who like to invest in turnarounds, that might mean it's time to put the stock on a watchlist, or research it. But others might consider the opportunity to have passed.
Investors should be looking to buy stocks that the market is wrong about. As value investor Benjamin Graham famously said, 'In the short run, the market is a voting machine but in the long run, it is a weighing machine. We don't have analyst forecasts, but shareholders might want to examine this detailed historical graph of earnings, revenue and cash flow.
But note: Lypsa Gems & Jewellery may not be the best stock to buy. So take a peek at this free list of interesting companies with strong recent earnings growth (and a P/E ratio below 20).
If you spot an error that warrants correction, please contact the editor at editorial-team@simplywallst.com. This article by Simply Wall St is general in nature. It does not constitute a recommendation to buy or sell any stock, and does not take account of your objectives, or your financial situation. Simply Wall St has no position in the stocks mentioned.
We aim to bring you long-term focused research analysis driven by fundamental data. Note that our analysis may not factor in the latest price-sensitive company announcements or qualitative material. Thank you for reading.
About NSEI:LYPSAGEMS
Moderate with imperfect balance sheet.
Similar Companies
Market Insights


Advertisement
Community Narratives
The Future of Drug Testing? Fingerprint Tech Shows Serious Promise
Fair Value US$2.98|40.3% undervalued
JO
Community Contributor
Suncorp’s Next Chapter: Insurance-Only and Ready to Grow
Fair Value AU$22.83|7.9% undervalued
RO
Community Contributor
Thyssenkrupp Nucera Will Achieve Double-Digit Profits by 2030 Boosted by Hydrogen Growth
Fair Value €14.40|31.6% undervalued
CH
Community Contributor
Tesla’s Nvidia Moment – The AI & Robotics Inflection Point
Fair Value US$359.72|12.3% undervalued
BL
Community Contributor