- United States
- /
- Machinery
- /
- NYSE:JBTM
What Is John Bean Technologies's (NYSE:JBT) P/E Ratio After Its Share Price Tanked?

To the annoyance of some shareholders, John Bean Technologies (NYSE:JBT) shares are down a considerable 30% in the last month. Even longer term holders have taken a real hit with the stock declining 11% in the last year.
All else being equal, a share price drop should make a stock more attractive to potential investors. In the long term, share prices tend to follow earnings per share, but in the short term prices bounce around in response to short term factors (which are not always obvious). So, on certain occasions, long term focussed investors try to take advantage of pessimistic expectations to buy shares at a better price. One way to gauge market expectations of a stock is to look at its Price to Earnings Ratio (PE Ratio). A high P/E implies that investors have high expectations of what a company can achieve compared to a company with a low P/E ratio.
See our latest analysis for John Bean Technologies
Does John Bean Technologies Have A Relatively High Or Low P/E For Its Industry?
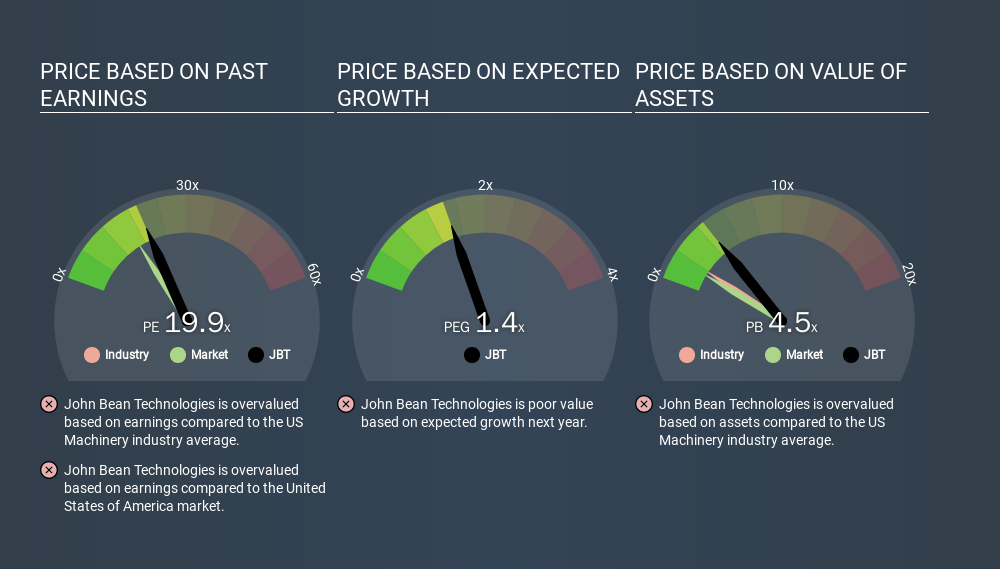
We can tell from its P/E ratio of 19.85 that there is some investor optimism about John Bean Technologies. As you can see below, John Bean Technologies has a higher P/E than the average company (17.7) in the machinery industry.
Its relatively high P/E ratio indicates that John Bean Technologies shareholders think it will perform better than other companies in its industry classification. Clearly the market expects growth, but it isn't guaranteed. So investors should always consider the P/E ratio alongside other factors, such as whether company directors have been buying shares.
How Growth Rates Impact P/E Ratios
Earnings growth rates have a big influence on P/E ratios. If earnings are growing quickly, then the 'E' in the equation will increase faster than it would otherwise. That means unless the share price increases, the P/E will reduce in a few years. A lower P/E should indicate the stock is cheap relative to others -- and that may attract buyers.
John Bean Technologies increased earnings per share by an impressive 24% over the last twelve months. And its annual EPS growth rate over 5 years is 31%. So one might expect an above average P/E ratio.
Remember: P/E Ratios Don't Consider The Balance Sheet
It's important to note that the P/E ratio considers the market capitalization, not the enterprise value. So it won't reflect the advantage of cash, or disadvantage of debt. Hypothetically, a company could reduce its future P/E ratio by spending its cash (or taking on debt) to achieve higher earnings.
Spending on growth might be good or bad a few years later, but the point is that the P/E ratio does not account for the option (or lack thereof).
John Bean Technologies's Balance Sheet
Net debt is 26% of John Bean Technologies's market cap. While it's worth keeping this in mind, it isn't a worry.
The Bottom Line On John Bean Technologies's P/E Ratio
John Bean Technologies trades on a P/E ratio of 19.9, which is above its market average of 15.1. While the company does use modest debt, its recent earnings growth is very good. So on this analysis it seems reasonable that its P/E ratio is above average. What can be absolutely certain is that the market has become significantly less optimistic about John Bean Technologies over the last month, with the P/E ratio falling from 28.5 back then to 19.9 today. For those who prefer to invest with the flow of momentum, that might be a bad sign, but for a contrarian, it may signal opportunity.
Investors should be looking to buy stocks that the market is wrong about. As value investor Benjamin Graham famously said, 'In the short run, the market is a voting machine but in the long run, it is a weighing machine. So this free visual report on analyst forecasts could hold the key to an excellent investment decision.
Of course, you might find a fantastic investment by looking at a few good candidates. So take a peek at this free list of companies with modest (or no) debt, trading on a P/E below 20.
If you spot an error that warrants correction, please contact the editor at editorial-team@simplywallst.com. This article by Simply Wall St is general in nature. It does not constitute a recommendation to buy or sell any stock, and does not take account of your objectives, or your financial situation. Simply Wall St has no position in the stocks mentioned.
We aim to bring you long-term focused research analysis driven by fundamental data. Note that our analysis may not factor in the latest price-sensitive company announcements or qualitative material. Thank you for reading.
About NYSE:JBTM
JBT Marel
Provides technology solutions to food and beverage industry in North America, Europe, the Middle East, Africa, the Asia Pacific, and Central and South America.
Fair value with moderate growth potential.
Similar Companies
Market Insights

Weekly Picks

THE KINGDOM OF BROWN GOODS: WHY MGPI IS BEING CRUSHED BY INVENTORY & PRIMED FOR RESURRECTION


Why Vertical Aerospace (NYSE: EVTL) is Worth Possibly Over 13x its Current Price


The Quiet Giant That Became AI’s Power Grid
Recently Updated Narratives


A case for USD $14.81 per share based on book value. Be warned, this is a micro-cap dependent on a single mine.

Occidental Petroleum to Become Fairly Priced at $68.29 According to Future Projections

Agfa-Gevaert is a digital and materials turnaround opportunity, with growth potential in ZIRFON, but carrying legacy risks.
Popular Narratives


MicroVision will explode future revenue by 380.37% with a vision towards success


Crazy Undervalued 42 Baggers Silver Play (Active & Running Mine)


