Advertisement
- United States
- /
- Consumer Services
- /
- NYSE:HRB
What Is H&R Block's (NYSE:HRB) P/E Ratio After Its Share Price Rocketed?
H&R Block (NYSE:HRB) shareholders are no doubt pleased to see that the share price has bounced 35% in the last month alone, although it is still down 28% over the last quarter. But shareholders may not all be feeling jubilant, since the share price is still down 40% in the last year.
All else being equal, a sharp share price increase should make a stock less attractive to potential investors. While the market sentiment towards a stock is very changeable, in the long run, the share price will tend to move in the same direction as earnings per share. So some would prefer to hold off buying when there is a lot of optimism towards a stock. Perhaps the simplest way to get a read on investors' expectations of a business is to look at its Price to Earnings Ratio (PE Ratio). Investors have optimistic expectations of companies with higher P/E ratios, compared to companies with lower P/E ratios.
Check out our latest analysis for H&R Block
How Does H&R Block's P/E Ratio Compare To Its Peers?
We can tell from its P/E ratio of 7.50 that sentiment around H&R Block isn't particularly high. We can see in the image below that the average P/E (22.2) for companies in the consumer services industry is higher than H&R Block's P/E.
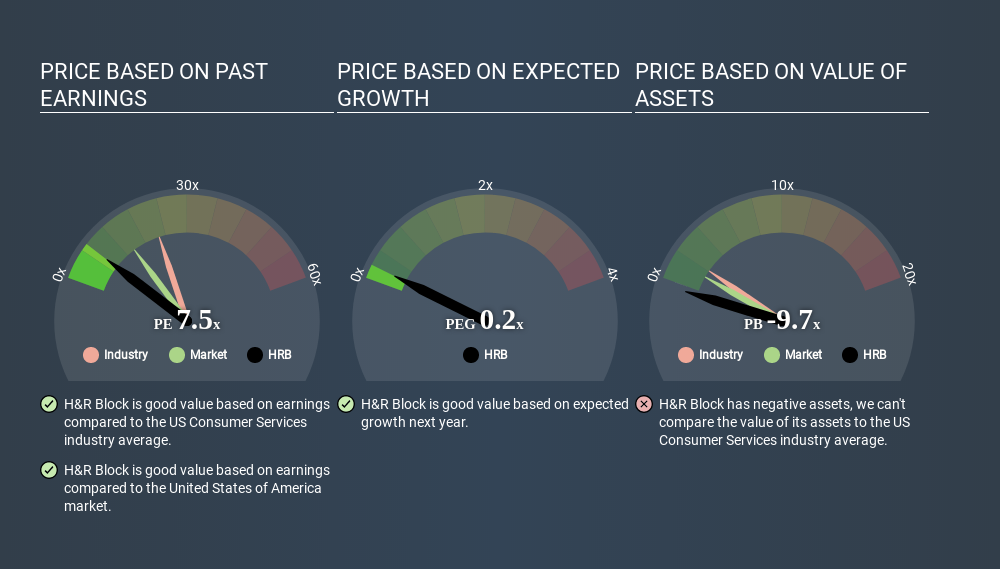
Its relatively low P/E ratio indicates that H&R Block shareholders think it will struggle to do as well as other companies in its industry classification. Many investors like to buy stocks when the market is pessimistic about their prospects. If you consider the stock interesting, further research is recommended. For example, I often monitor director buying and selling.
How Growth Rates Impact P/E Ratios
Earnings growth rates have a big influence on P/E ratios. Earnings growth means that in the future the 'E' will be higher. That means unless the share price increases, the P/E will reduce in a few years. So while a stock may look expensive based on past earnings, it could be cheap based on future earnings.
H&R Block saw earnings per share decrease by 37% last year. But EPS is up 11% over the last 3 years. And EPS is down 2.6% a year, over the last 5 years. This might lead to muted expectations.
A Limitation: P/E Ratios Ignore Debt and Cash In The Bank
One drawback of using a P/E ratio is that it considers market capitalization, but not the balance sheet. Thus, the metric does not reflect cash or debt held by the company. The exact same company would hypothetically deserve a higher P/E ratio if it had a strong balance sheet, than if it had a weak one with lots of debt, because a cashed up company can spend on growth.
Such expenditure might be good or bad, in the long term, but the point here is that the balance sheet is not reflected by this ratio.
H&R Block's Balance Sheet
H&R Block has net debt worth 76% of its market capitalization. This is a reasonably significant level of debt -- all else being equal you'd expect a much lower P/E than if it had net cash.
The Verdict On H&R Block's P/E Ratio
H&R Block trades on a P/E ratio of 7.5, which is below the US market average of 14.4. Given meaningful debt, and a lack of recent growth, the market looks to be extrapolating this recent performance; reflecting low expectations for the future. What we know for sure is that investors are becoming less uncomfortable about H&R Block's prospects, since they have pushed its P/E ratio from 5.6 to 7.5 over the last month. If you like to buy stocks that could be turnaround opportunities, then this one might be a candidate; but if you're more sensitive to price, then you may feel the opportunity has passed.
Investors should be looking to buy stocks that the market is wrong about. If the reality for a company is not as bad as the P/E ratio indicates, then the share price should increase as the market realizes this. So this free visual report on analyst forecasts could hold the key to an excellent investment decision.
But note: H&R Block may not be the best stock to buy. So take a peek at this free list of interesting companies with strong recent earnings growth (and a P/E ratio below 20).
If you spot an error that warrants correction, please contact the editor at editorial-team@simplywallst.com. This article by Simply Wall St is general in nature. It does not constitute a recommendation to buy or sell any stock, and does not take account of your objectives, or your financial situation. Simply Wall St has no position in the stocks mentioned.
We aim to bring you long-term focused research analysis driven by fundamental data. Note that our analysis may not factor in the latest price-sensitive company announcements or qualitative material. Thank you for reading.
About NYSE:HRB
H&R Block
Through its subsidiaries, provides assisted and do-it-yourself (DIY) tax return preparation services in the United States, Canada, and Australia.
6 star dividend payer and undervalued.
Similar Companies
Market Insights


Advertisement
Weekly Picks
LO


Lou_Basenese on Cue Biopharma ·
Cue Biopharma (NASDAQ: CUE): The Scientist Behind Xolair Just Gave Cue a Next-Generation Shot at the Same Multi-Billion-Dollar Market
Fair Value:US$7065.0% undervalued
42 followersusers have followed this narrative
0 commentsusers have commented on this narrative
8 likesusers have liked this narrative
HA


HarishPK on Adobe ·
Adobe: A Probabilistic Case for Undervaluation
Fair Value:US$319.9636.2% undervalued
46 followersusers have followed this narrative
8 commentsusers have commented on this narrative
16 likesusers have liked this narrative
NI


niteco on Broadcom ·
A Capital Allocation Favorite with Structural Importance
Fair Value:US$651.0541.3% undervalued
45 followersusers have followed this narrative
0 commentsusers have commented on this narrative
8 likesusers have liked this narrative
TO


Tokyo on Okta ·
Good foundation, but now it's all about the next steps
Fair Value:US$15123.0% undervalued
91 followersusers have followed this narrative
7 commentsusers have commented on this narrative
11 likesusers have liked this narrative
Recently Updated Narratives
JA


Janpeo on Space Exploration Technologies ·
The trap for retailers that can evaporate more than 80% of the value.
Fair Value:US$28.55463.7% overvalued
1 followerusers have followed this narrative
0 commentsusers have commented on this narrative
0 likesusers have liked this narrative
AS


AstrisCorporateAdvisory on Macbee Planet ·
Approaching an inflection point
Fair Value:JP¥1.08k7.2% undervalued
1 followerusers have followed this narrative
0 commentsusers have commented on this narrative
0 likesusers have liked this narrative
XX

xxlfm on NVIDIA ·
Are you worrying about Michael Burry’s Short?!
Fair Value:CA$532.5991.4% undervalued
1 followerusers have followed this narrative
0 commentsusers have commented on this narrative
0 likesusers have liked this narrative
Popular Narratives
MA


martinarauz on Nu Holdings ·
Investment Analysis (May 2026)
Fair Value:US$22.7446.4% undervalued
66 followersusers have followed this narrative
0 commentsusers have commented on this narrative
16 likesusers have liked this narrative
CL


Clive_Thompson on Take-Two Interactive Software ·
Take-Two Interactive: The Calm Before the Storm NASDAQ: TTWO Last Price: $242.41 Date: May 15, 2026
Fair Value:US$276.9723.5% undervalued
58 followersusers have followed this narrative
0 commentsusers have commented on this narrative
14 likesusers have liked this narrative
NI

niteco on Honeywell International ·
Honeywell - The Demand-Side of the AI Infrastructure
Fair Value:US$320.1931.2% undervalued
50 followersusers have followed this narrative
0 commentsusers have commented on this narrative
19 likesusers have liked this narrative
