
Advertisement

Unfortunately for some shareholders, the Enerplus (TSE:ERF) share price has dived 32% in the last thirty days. That drop has capped off a tough year for shareholders, with the share price down 42% in that time.
Assuming nothing else has changed, a lower share price makes a stock more attractive to potential buyers. While the market sentiment towards a stock is very changeable, in the long run, the share price will tend to move in the same direction as earnings per share. The implication here is that long term investors have an opportunity when expectations of a company are too low. One way to gauge market expectations of a stock is to look at its Price to Earnings Ratio (PE Ratio). Investors have optimistic expectations of companies with higher P/E ratios, compared to companies with lower P/E ratios.
Check out our latest analysis for Enerplus
How Does Enerplus's P/E Ratio Compare To Its Peers?
Enerplus's P/E of 3.66 indicates relatively low sentiment towards the stock. We can see in the image below that the average P/E (11.6) for companies in the oil and gas industry is higher than Enerplus's P/E.
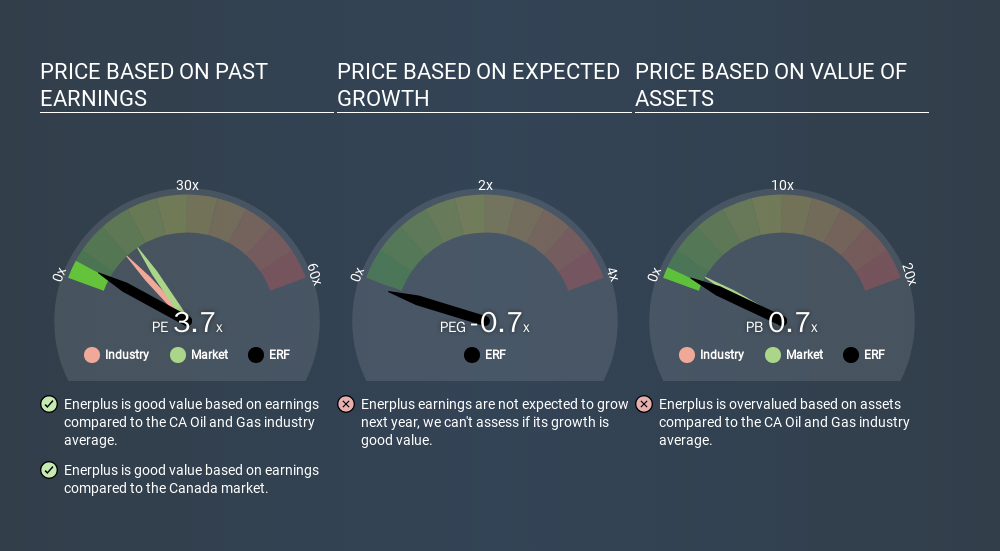
This suggests that market participants think Enerplus will underperform other companies in its industry. While current expectations are low, the stock could be undervalued if the situation is better than the market assumes. You should delve deeper. I like to check if company insiders have been buying or selling.
How Growth Rates Impact P/E Ratios
Earnings growth rates have a big influence on P/E ratios. Earnings growth means that in the future the 'E' will be higher. And in that case, the P/E ratio itself will drop rather quickly. Then, a lower P/E should attract more buyers, pushing the share price up.
Enerplus's 200% EPS improvement over the last year was like bamboo growth after rain; rapid and impressive. The sweetener is that the annual five year growth rate of 15% is also impressive. So I'd be surprised if the P/E ratio was not above average.
Don't Forget: The P/E Does Not Account For Debt or Bank Deposits
Don't forget that the P/E ratio considers market capitalization. Thus, the metric does not reflect cash or debt held by the company. Hypothetically, a company could reduce its future P/E ratio by spending its cash (or taking on debt) to achieve higher earnings.
Such spending might be good or bad, overall, but the key point here is that you need to look at debt to understand the P/E ratio in context.
So What Does Enerplus's Balance Sheet Tell Us?
Enerplus has net debt equal to 36% of its market cap. While that's enough to warrant consideration, it doesn't really concern us.
The Bottom Line On Enerplus's P/E Ratio
Enerplus's P/E is 3.7 which is below average (15.4) in the CA market. The company does have a little debt, and EPS growth was good last year. If it continues to grow, then the current low P/E may prove to be unjustified. Given Enerplus's P/E ratio has declined from 5.4 to 3.7 in the last month, we know for sure that the market is more worried about the business today, than it was back then. For those who prefer to invest with the flow of momentum, that might be a bad sign, but for deep value investors this stock might justify some research.
When the market is wrong about a stock, it gives savvy investors an opportunity. If the reality for a company is not as bad as the P/E ratio indicates, then the share price should increase as the market realizes this. So this free report on the analyst consensus forecasts could help you make a master move on this stock.
But note: Enerplus may not be the best stock to buy. So take a peek at this free list of interesting companies with strong recent earnings growth (and a P/E ratio below 20).
If you spot an error that warrants correction, please contact the editor at editorial-team@simplywallst.com. This article by Simply Wall St is general in nature. It does not constitute a recommendation to buy or sell any stock, and does not take account of your objectives, or your financial situation. Simply Wall St has no position in the stocks mentioned.
We aim to bring you long-term focused research analysis driven by fundamental data. Note that our analysis may not factor in the latest price-sensitive company announcements or qualitative material. Thank you for reading.
About TSX:ERF
Enerplus
Explores and develops crude oil and natural gas in the United States.
Undervalued with adequate balance sheet.
Similar Companies
Market Insights


Advertisement
Community Narratives
For the Emperor: Why Games Workshop Could Be a Star Investment
Fair Value UK£160.00|0.4% overvalued
RO
Community Contributor
Securitas will boost margins with AI and tech-driven services
Fair Value SEK 260.91|44.5% undervalued
UN
Community Contributor
A Leader in EV Charging with Growth Potential
Fair Value €27.00|17.8% undervalued
TI
Community Contributor