
Advertisement
- Australia
- /
- Oil and Gas
- /
- ASX:BYE
What Does Byron Energy Limited’s (ASX:BYE) 15% ROCE Say About The Business?

Today we'll look at Byron Energy Limited (ASX:BYE) and reflect on its potential as an investment. Specifically, we'll consider its Return On Capital Employed (ROCE), since that will give us an insight into how efficiently the business can generate profits from the capital it requires.
First up, we'll look at what ROCE is and how we calculate it. Second, we'll look at its ROCE compared to similar companies. Finally, we'll look at how its current liabilities affect its ROCE.
Understanding Return On Capital Employed (ROCE)
ROCE measures the amount of pre-tax profits a company can generate from the capital employed in its business. All else being equal, a better business will have a higher ROCE. Ultimately, it is a useful but imperfect metric. Author Edwin Whiting says to be careful when comparing the ROCE of different businesses, since 'No two businesses are exactly alike.
How Do You Calculate Return On Capital Employed?
Analysts use this formula to calculate return on capital employed:
Return on Capital Employed = Earnings Before Interest and Tax (EBIT) ÷ (Total Assets - Current Liabilities)
Or for Byron Energy:
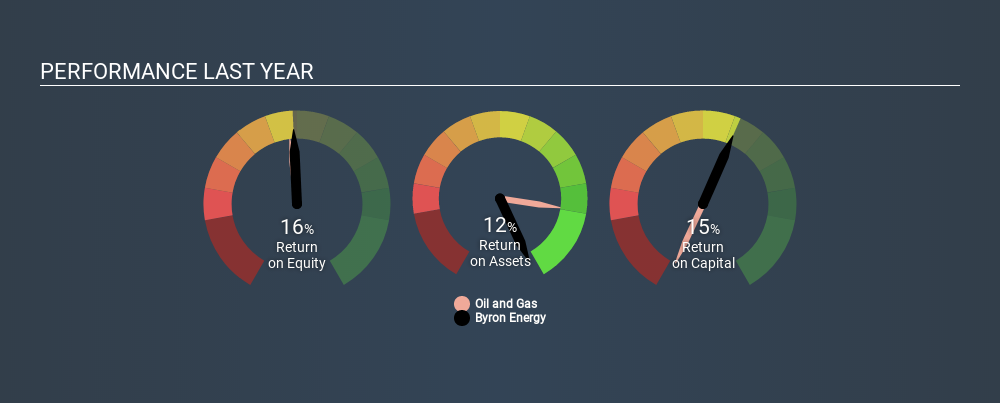
0.15 = US$5.7m ÷ (US$53m - US$15m) (Based on the trailing twelve months to June 2019.)
So, Byron Energy has an ROCE of 15%.
See our latest analysis for Byron Energy
Is Byron Energy's ROCE Good?
ROCE is commonly used for comparing the performance of similar businesses. Using our data, Byron Energy's ROCE appears to be around the 13% average of the Oil and Gas industry. Separate from Byron Energy's performance relative to its industry, its ROCE in absolute terms looks satisfactory, and it may be worth researching in more depth.
Byron Energy reported an ROCE of 15% -- better than 3 years ago, when the company didn't make a profit. That suggests the business has returned to profitability. You can click on the image below to see (in greater detail) how Byron Energy's past growth compares to other companies.
It is important to remember that ROCE shows past performance, and is not necessarily predictive. ROCE can be misleading for companies in cyclical industries, with returns looking impressive during the boom times, but very weak during the busts. ROCE is only a point-in-time measure. We note Byron Energy could be considered a cyclical business. Future performance is what matters, and you can see analyst predictions in our free report on analyst forecasts for the company.
What Are Current Liabilities, And How Do They Affect Byron Energy's ROCE?
Current liabilities are short term bills and invoices that need to be paid in 12 months or less. Due to the way the ROCE equation works, having large bills due in the near term can make it look as though a company has less capital employed, and thus a higher ROCE than usual. To counteract this, we check if a company has high current liabilities, relative to its total assets.
Byron Energy has current liabilities of US$15m and total assets of US$53m. Therefore its current liabilities are equivalent to approximately 28% of its total assets. Current liabilities are minimal, limiting the impact on ROCE.
Our Take On Byron Energy's ROCE
With that in mind, Byron Energy's ROCE appears pretty good. Byron Energy looks strong on this analysis, but there are plenty of other companies that could be a good opportunity . Here is a free list of companies growing earnings rapidly.
Byron Energy is not the only stock that insiders are buying. For those who like to find winning investments this free list of growing companies with recent insider purchasing, could be just the ticket.
If you spot an error that warrants correction, please contact the editor at editorial-team@simplywallst.com. This article by Simply Wall St is general in nature. It does not constitute a recommendation to buy or sell any stock, and does not take account of your objectives, or your financial situation. Simply Wall St has no position in the stocks mentioned.
We aim to bring you long-term focused research analysis driven by fundamental data. Note that our analysis may not factor in the latest price-sensitive company announcements or qualitative material. Thank you for reading.
About ASX:BYE
Byron Energy
Engages in the exploration, development, and production of oil and gas properties.
Low and fair value.
Similar Companies
Market Insights


Advertisement
Community Narratives
The Future of Drug Testing? Fingerprint Tech Shows Serious Promise
Fair Value US$2.98|40.3% undervalued
JO
Community Contributor
Suncorp’s Next Chapter: Insurance-Only and Ready to Grow
Fair Value AU$22.83|7.9% undervalued
RO
Community Contributor
Thyssenkrupp Nucera Will Achieve Double-Digit Profits by 2030 Boosted by Hydrogen Growth
Fair Value €14.40|31.6% undervalued
CH
Community Contributor
Tesla’s Nvidia Moment – The AI & Robotics Inflection Point
Fair Value US$359.72|12.3% undervalued
BL
Community Contributor