
Advertisement

Even when a business is losing money, it's possible for shareholders to make money if they buy a good business at the right price. For example, biotech and mining exploration companies often lose money for years before finding success with a new treatment or mineral discovery. Having said that, unprofitable companies are risky because they could potentially burn through all their cash and become distressed.
So should Seabridge Gold (TSE:SEA) shareholders be worried about its cash burn? For the purpose of this article, we'll define cash burn as the amount of cash the company is spending each year to fund its growth (also called its negative free cash flow). The first step is to compare its cash burn with its cash reserves, to give us its 'cash runway'.
Check out our latest analysis for Seabridge Gold
Does Seabridge Gold Have A Long Cash Runway?
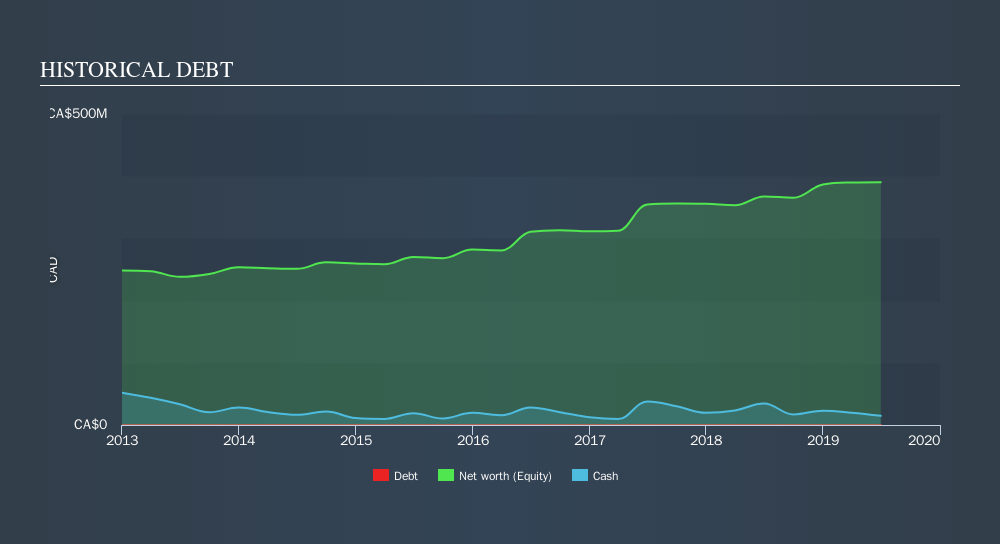
A company's cash runway is the amount of time it would take to burn through its cash reserves at its current cash burn rate. As at June 2019, Seabridge Gold had cash of CA$15m and no debt. Importantly, its cash burn was CA$45m over the trailing twelve months. Therefore, from June 2019 it had roughly 4 months of cash runway. That's a very short cash runway which indicates an imminent need to douse the cash burn or find more funding. Depicted below, you can see how its cash holdings have changed over time.
How Is Seabridge Gold's Cash Burn Changing Over Time?
Because Seabridge Gold isn't currently generating revenue, we consider it an early-stage business. So while we can't look to sales to understand growth, we can look at how the cash burn is changing to understand how expenditure is trending over time. With the cash burn rate up 34% in the last year, it seems that the company is ratcheting up investment in the business over time. However, the company's true cash runway will therefore be shorter than suggested above, if spending continues to increase. While the past is always worth studying, it is the future that matters most of all. So you might want to take a peek at how much the company is expected to grow in the next few years.
How Easily Can Seabridge Gold Raise Cash?
Given its cash burn trajectory, Seabridge Gold shareholders should already be thinking about how easy it might be for it to raise further cash in the future. Generally speaking, a listed business can raise new cash through issuing shares or taking on debt. Commonly, a business will sell new shares in itself to raise cash to drive growth. By comparing a company's annual cash burn to its total market capitalisation, we can estimate roughly how many shares it would have to issue in order to run the company for another year (at the same burn rate).
Since it has a market capitalisation of CA$1.1b, Seabridge Gold's CA$45m in cash burn equates to about 4.2% of its market value. Given that is a rather small percentage, it would probably be really easy for the company to fund another year's growth by issuing some new shares to investors, or even by taking out a loan.
So, Should We Worry About Seabridge Gold's Cash Burn?
Even though its cash runway makes us a little nervous, we are compelled to mention that we thought Seabridge Gold's cash burn relative to its market cap was relatively promising. Summing up, we think the Seabridge Gold's cash burn is a risk, based on the factors we mentioned in this article. When you don't have traditional metrics like earnings per share and free cash flow to value a company, many are extra motivated to consider qualitative factors such as whether insiders are buying or selling shares. Please Note: Seabridge Gold insiders have been trading shares, according to our data. Click here to check whether insiders have been buying or selling.
Of course, you might find a fantastic investment by looking elsewhere. So take a peek at this free list of companies insiders are buying, and this list of stocks growth stocks (according to analyst forecasts)
We aim to bring you long-term focused research analysis driven by fundamental data. Note that our analysis may not factor in the latest price-sensitive company announcements or qualitative material.
If you spot an error that warrants correction, please contact the editor at editorial-team@simplywallst.com. This article by Simply Wall St is general in nature. It does not constitute a recommendation to buy or sell any stock, and does not take account of your objectives, or your financial situation. Simply Wall St has no position in the stocks mentioned. Thank you for reading.
About TSX:SEA
Seabridge Gold
Engages in the acquisition and exploration of gold properties in North America.
Slight with mediocre balance sheet.
Market Insights


Advertisement
Community Narratives
The Future of Drug Testing? Fingerprint Tech Shows Serious Promise
Fair Value US$2.98|40.3% undervalued
JO
Community Contributor
Suncorp’s Next Chapter: Insurance-Only and Ready to Grow
Fair Value AU$22.83|7.9% undervalued
RO
Community Contributor
Thyssenkrupp Nucera Will Achieve Double-Digit Profits by 2030 Boosted by Hydrogen Growth
Fair Value €14.40|31.6% undervalued
CH
Community Contributor
Tesla’s Nvidia Moment – The AI & Robotics Inflection Point
Fair Value US$359.72|12.3% undervalued
BL
Community Contributor