

Warren Buffett famously said, 'Volatility is far from synonymous with risk.' It's only natural to consider a company's balance sheet when you examine how risky it is, since debt is often involved when a business collapses. As with many other companies S Chand and Company Limited (NSE:SCHAND) makes use of debt. But the real question is whether this debt is making the company risky.
What Risk Does Debt Bring?
Generally speaking, debt only becomes a real problem when a company can't easily pay it off, either by raising capital or with its own cash flow. If things get really bad, the lenders can take control of the business. While that is not too common, we often do see indebted companies permanently diluting shareholders because lenders force them to raise capital at a distressed price. Having said that, the most common situation is where a company manages its debt reasonably well - and to its own advantage. When we think about a company's use of debt, we first look at cash and debt together.
See our latest analysis for S Chand
What Is S Chand's Debt?
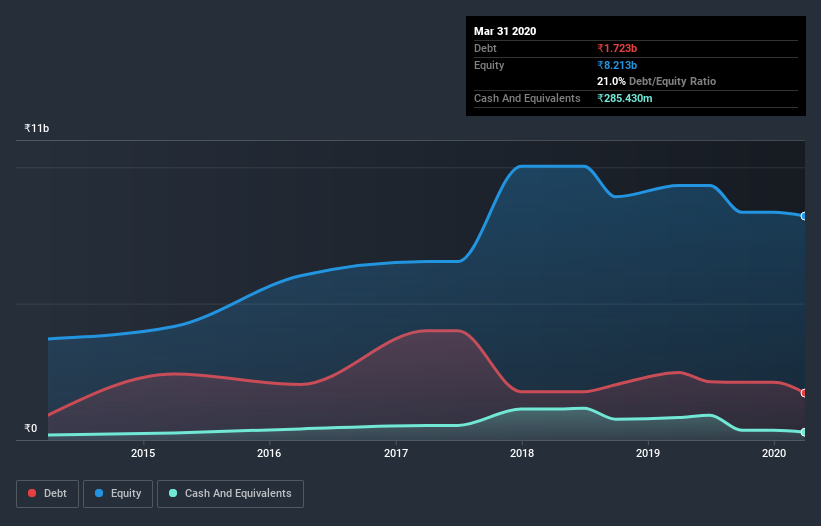
You can click the graphic below for the historical numbers, but it shows that S Chand had ₹1.72b of debt in March 2020, down from ₹2.48b, one year before. On the flip side, it has ₹285.4m in cash leading to net debt of about ₹1.44b.
How Strong Is S Chand's Balance Sheet?
The latest balance sheet data shows that S Chand had liabilities of ₹3.65b due within a year, and liabilities of ₹1.04b falling due after that. Offsetting these obligations, it had cash of ₹285.4m as well as receivables valued at ₹3.41b due within 12 months. So its liabilities total ₹1.0b more than the combination of its cash and short-term receivables.
While this might seem like a lot, it is not so bad since S Chand has a market capitalization of ₹2.21b, and so it could probably strengthen its balance sheet by raising capital if it needed to. But it's clear that we should definitely closely examine whether it can manage its debt without dilution. There's no doubt that we learn most about debt from the balance sheet. But ultimately the future profitability of the business will decide if S Chand can strengthen its balance sheet over time. So if you're focused on the future you can check out this free report showing analyst profit forecasts.
Over 12 months, S Chand made a loss at the EBIT level, and saw its revenue drop to ₹4.3b, which is a fall of 18%. We would much prefer see growth.
Caveat Emptor
Not only did S Chand's revenue slip over the last twelve months, but it also produced negative earnings before interest and tax (EBIT). Its EBIT loss was a whopping ₹627.6m. When we look at that and recall the liabilities on its balance sheet, relative to cash, it seems unwise to us for the company to have any debt. So we think its balance sheet is a little strained, though not beyond repair. For example, we would not want to see a repeat of last year's loss of ₹1.1b. In the meantime, we consider the stock very risky. When analysing debt levels, the balance sheet is the obvious place to start. But ultimately, every company can contain risks that exist outside of the balance sheet. Case in point: We've spotted 2 warning signs for S Chand you should be aware of.
When all is said and done, sometimes its easier to focus on companies that don't even need debt. Readers can access a list of growth stocks with zero net debt 100% free, right now.
If you’re looking to trade S Chand, open an account with the lowest-cost* platform trusted by professionals, Interactive Brokers. Their clients from over 200 countries and territories trade stocks, options, futures, forex, bonds and funds worldwide from a single integrated account. Promoted
New: Manage All Your Stock Portfolios in One Place
We've created the ultimate portfolio companion for stock investors, and it's free.
• Connect an unlimited number of Portfolios and see your total in one currency
• Be alerted to new Warning Signs or Risks via email or mobile
• Track the Fair Value of your stocks
This article by Simply Wall St is general in nature. It does not constitute a recommendation to buy or sell any stock, and does not take account of your objectives, or your financial situation. We aim to bring you long-term focused analysis driven by fundamental data. Note that our analysis may not factor in the latest price-sensitive company announcements or qualitative material. Simply Wall St has no position in any stocks mentioned.
*Interactive Brokers Rated Lowest Cost Broker by StockBrokers.com Annual Online Review 2020
Have feedback on this article? Concerned about the content? Get in touch with us directly. Alternatively, email editorial-team@simplywallst.com.
About NSEI:SCHAND
S Chand
S Chand and Company Limited, an education content company, develops and delivers content, solutions, and services for the early learning, K-12, and higher education segments in India.
Flawless balance sheet with solid track record and pays a dividend.
Similar Companies
Market Insights

Community Narratives

