
Advertisement
- United States
- /
- Electrical
- /
- NYSE:HUBB
Volatility 101: Should Hubbell (NYSE:HUBB) Shares Have Dropped 14%?

It's understandable if you feel frustrated when a stock you own sees a lower share price. But sometimes a share price fall can have more to do with market conditions than the performance of the specific business. The Hubbell Incorporated (NYSE:HUBB) is down 14% over a year, but the total shareholder return is -12% once you include the dividend. And that total return actually beats the market return of -14%. At least the damage isn't so bad if you look at the last three years, since the stock is down 10% in that time. It's down 27% in about a quarter. However, one could argue that the price has been influenced by the general market, which is down 24% in the same timeframe.
Check out our latest analysis for Hubbell
While markets are a powerful pricing mechanism, share prices reflect investor sentiment, not just underlying business performance. One way to examine how market sentiment has changed over time is to look at the interaction between a company's share price and its earnings per share (EPS).
Even though the Hubbell share price is down over the year, its EPS actually improved. Of course, the situation might betray previous over-optimism about growth.
The divergence between the EPS and the share price is quite notable, during the year. But we might find some different metrics explain the share price movements better.
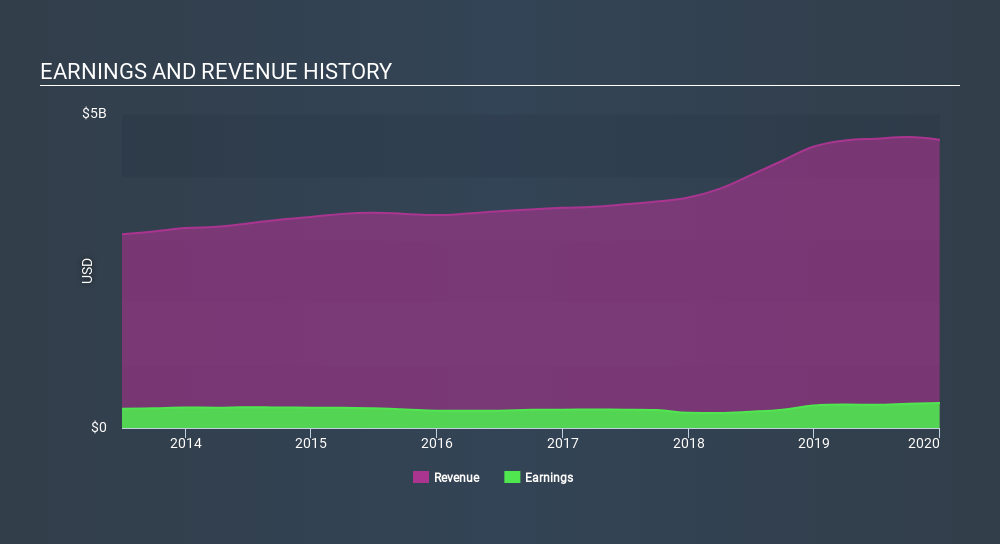
Revenue was fairly steady year on year, which isn't usually such a bad thing. However, it is certainly possible the market was expecting an uptick in revenue, and that the share price fall reflects that disappointment.
You can see how earnings and revenue have changed over time in the image below (click on the chart to see the exact values).
We know that Hubbell has improved its bottom line lately, but what does the future have in store? You can see what analysts are predicting for Hubbell in this interactive graph of future profit estimates.
What About Dividends?
It is important to consider the total shareholder return, as well as the share price return, for any given stock. Whereas the share price return only reflects the change in the share price, the TSR includes the value of dividends (assuming they were reinvested) and the benefit of any discounted capital raising or spin-off. It's fair to say that the TSR gives a more complete picture for stocks that pay a dividend. We note that for Hubbell the TSR over the last year was -12%, which is better than the share price return mentioned above. This is largely a result of its dividend payments!
A Different Perspective
Although it hurts that Hubbell returned a loss of 12% in the last twelve months, the broader market was actually worse, returning a loss of 14%. Of course, the long term returns are far more important and the good news is that over five years, the stock has returned 2.1% for each year. It could be that the business is just facing some short term problems, but shareholders should keep a close eye on the fundamentals. It's always interesting to track share price performance over the longer term. But to understand Hubbell better, we need to consider many other factors. For instance, we've identified 2 warning signs for Hubbell that you should be aware of.
But note: Hubbell may not be the best stock to buy. So take a peek at this free list of interesting companies with past earnings growth (and further growth forecast).
Please note, the market returns quoted in this article reflect the market weighted average returns of stocks that currently trade on US exchanges.
If you spot an error that warrants correction, please contact the editor at editorial-team@simplywallst.com. This article by Simply Wall St is general in nature. It does not constitute a recommendation to buy or sell any stock, and does not take account of your objectives, or your financial situation. Simply Wall St has no position in the stocks mentioned.
We aim to bring you long-term focused research analysis driven by fundamental data. Note that our analysis may not factor in the latest price-sensitive company announcements or qualitative material. Thank you for reading.
About NYSE:HUBB
Hubbell
Designs, manufactures, and sells electrical and utility solutions in the United States and internationally.
Solid track record with excellent balance sheet and pays a dividend.
Similar Companies
Market Insights


Advertisement
Community Narratives
The Future of Drug Testing? Fingerprint Tech Shows Serious Promise
Fair Value US$2.98|40.3% undervalued
JO
Community Contributor
Suncorp’s Next Chapter: Insurance-Only and Ready to Grow
Fair Value AU$22.83|7.9% undervalued
RO
Community Contributor
Thyssenkrupp Nucera Will Achieve Double-Digit Profits by 2030 Boosted by Hydrogen Growth
Fair Value €14.40|31.6% undervalued
CH
Community Contributor
Tesla’s Nvidia Moment – The AI & Robotics Inflection Point
Fair Value US$359.72|12.3% undervalued
BL
Community Contributor