Advertisement
- United States
- /
- Software
- /
- NYSE:TUYA
Uncovering Opportunities: Grab Holdings And 2 Other Compelling Penny Stocks

Simply Wall St
Reviewed by Simply Wall St

As the Nasdaq reaches record highs, driven by surging chip stocks and Apple's recent gains, investors are keenly observing the shifting landscape of market opportunities. Penny stocks may be a throwback term, but the opportunities they represent are far from old news. Typically referring to smaller or newer companies, these stocks present an underappreciated chance for growth at lower price points.
Top 10 Penny Stocks In The United States
| Name | Share Price | Market Cap | Rewards & Risks |
| Waterdrop (WDH) | $1.74 | $625.68M | ✅ 4 ⚠️ 0 View Analysis > |
| Vasta Platform (VSTA) | $4.23 | $341.7M | ✅ 4 ⚠️ 1 View Analysis > |
| WM Technology (MAPS) | $0.902 | $160.27M | ✅ 4 ⚠️ 1 View Analysis > |
| Performance Shipping (PSHG) | $1.80 | $22.75M | ✅ 4 ⚠️ 2 View Analysis > |
| Tuniu (TOUR) | $0.9326 | $90.93M | ✅ 3 ⚠️ 2 View Analysis > |
| Riverview Bancorp (RVSB) | $4.88 | $104.04M | ✅ 3 ⚠️ 1 View Analysis > |
| BAB (BABB) | $0.9144 | $6.54M | ✅ 2 ⚠️ 3 View Analysis > |
| Lifetime Brands (LCUT) | $3.93 | $93.69M | ✅ 3 ⚠️ 3 View Analysis > |
| Resources Connection (RGP) | $4.64 | $156.36M | ✅ 3 ⚠️ 1 View Analysis > |
| TETRA Technologies (TTI) | $3.89 | $519.79M | ✅ 3 ⚠️ 2 View Analysis > |
Click here to see the full list of 415 stocks from our US Penny Stocks screener.
Let's dive into some prime choices out of the screener.
Grab Holdings (GRAB)
Simply Wall St Financial Health Rating: ★★★★★☆
Overview: Grab Holdings Limited operates as a superapp provider in Southeast Asia, offering a range of services across Cambodia, Indonesia, Malaysia, Myanmar, the Philippines, Singapore, Thailand and Vietnam with a market cap of approximately $19.44 billion.
Operations: Grab Holdings Limited does not report specific revenue segments.
Market Cap: $19.44B
Grab Holdings has shown significant financial improvement, becoming profitable with a net income of US$35 million in Q2 2025, compared to a loss the previous year. The company executed a substantial share buyback program, repurchasing shares worth US$499.6 million. Grab's short-term assets exceed both its short and long-term liabilities, indicating strong liquidity. Despite low return on equity at 0.9%, the company's debt is well-covered by operating cash flow and it holds more cash than total debt. Analysts suggest potential stock price appreciation as it trades below estimated fair value by 36.5%.
- Dive into the specifics of Grab Holdings here with our thorough balance sheet health report.
- Learn about Grab Holdings' future growth trajectory here.
Gold Royalty (GROY)
Simply Wall St Financial Health Rating: ★★★★☆☆
Overview: Gold Royalty Corp. is a precious metals-focused royalty company that offers financing solutions to the metals and mining industry, with a market cap of approximately $525.78 million.
Operations: Gold Royalty Corp. does not report distinct revenue segments.
Market Cap: $525.78M
Gold Royalty Corp. has demonstrated revenue growth, with second-quarter sales reaching US$3.82 million, up from US$1.79 million the previous year. Despite being unprofitable, the company has narrowed its net loss to US$0.829 million from US$2.24 million a year ago and reduced losses over five years by 5.1% annually. Its management and board are experienced, with average tenures of 3.8 and 4.4 years respectively, while maintaining a satisfactory net debt to equity ratio of 8.7%. The company is trading at a significant discount to its estimated fair value but faces challenges covering long-term liabilities with short-term assets of $7.2M against $177M in liabilities.
- Navigate through the intricacies of Gold Royalty with our comprehensive balance sheet health report here.
- Examine Gold Royalty's earnings growth report to understand how analysts expect it to perform.

Tuya (TUYA)
Simply Wall St Financial Health Rating: ★★★★★★
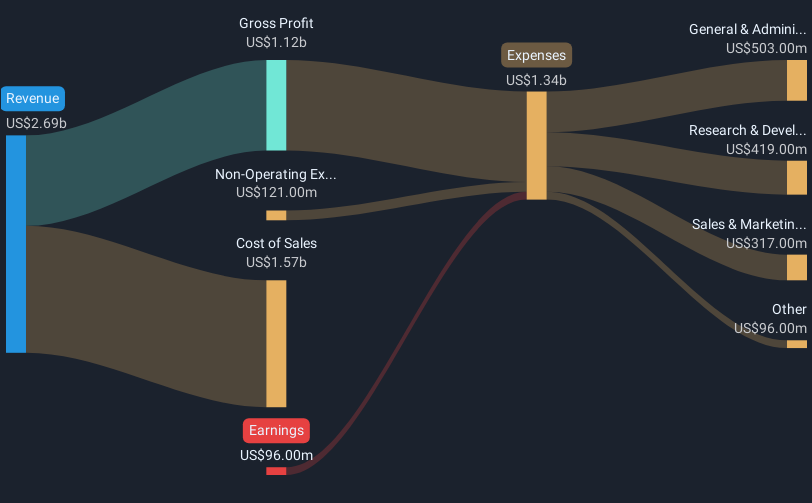
Overview: Tuya Inc. operates as an AI cloud platform service provider in the People's Republic of China and internationally, with a market cap of $1.43 billion.
Operations: The company generates revenue from its Internet Software & Services segment, totaling $311.64 million.
Market Cap: $1.43B
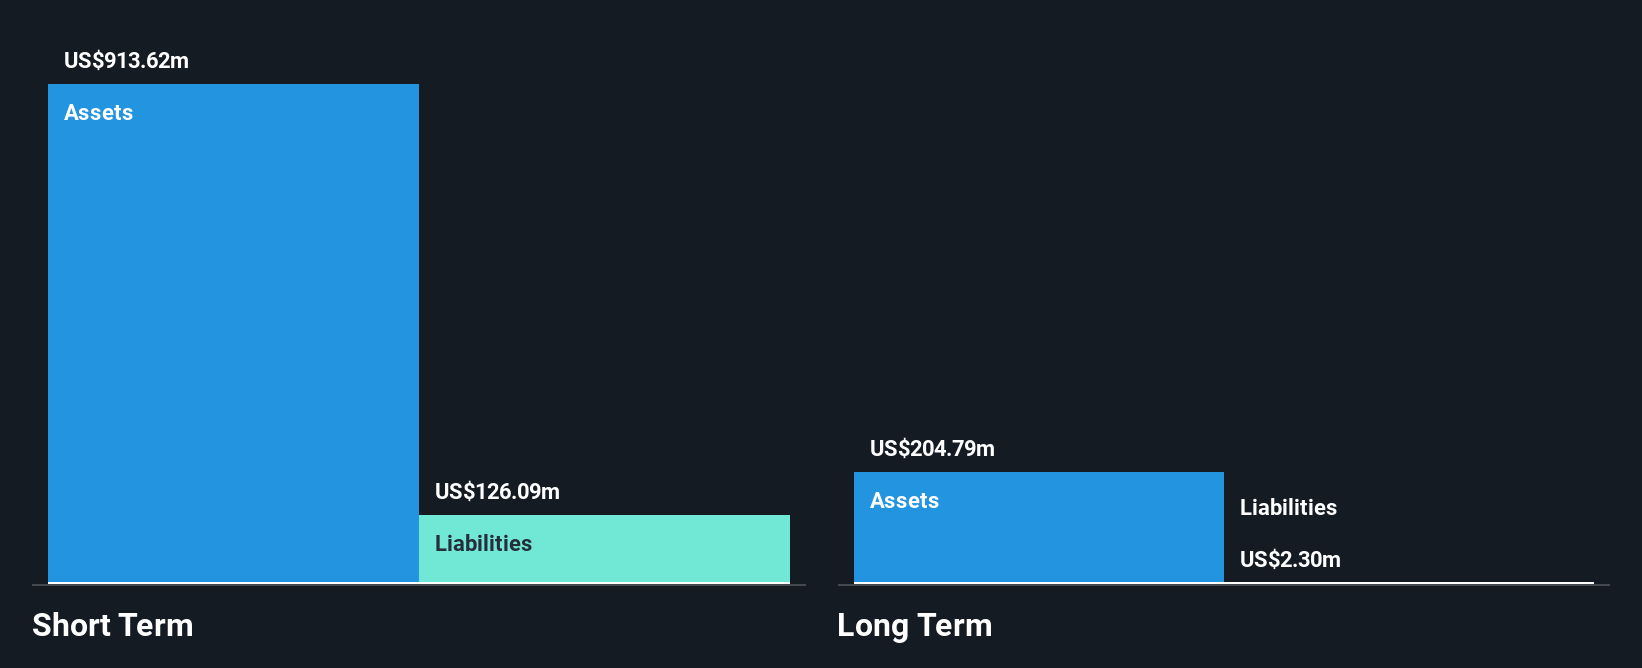
Tuya Inc., operating without debt for five years, has recently achieved profitability with a net income of US$11.02 million in Q1 2025, compared to a loss the previous year. Despite low return on equity at 2%, its strong financial position is supported by short-term assets of US$913.6 million exceeding liabilities significantly. Earnings are projected to grow by 25.11% annually, and analysts anticipate a stock price rise of 32.7%. Recent board changes and amendments to company bylaws aim to enhance governance and align with regulatory updates, reflecting proactive corporate management amidst stable weekly volatility.
- Click here and access our complete financial health analysis report to understand the dynamics of Tuya.
- Explore Tuya's analyst forecasts in our growth report.
Where To Now?
- Navigate through the entire inventory of 415 US Penny Stocks here.
- Contemplating Other Strategies? Rare earth metals are an input to most high-tech devices, military and defence systems and electric vehicles. The global race is on to secure supply of these critical minerals. Beat the pack to uncover the 25 best rare earth metal stocks of the very few that mine this essential strategic resource.
This article by Simply Wall St is general in nature. We provide commentary based on historical data and analyst forecasts only using an unbiased methodology and our articles are not intended to be financial advice. It does not constitute a recommendation to buy or sell any stock, and does not take account of your objectives, or your financial situation. We aim to bring you long-term focused analysis driven by fundamental data. Note that our analysis may not factor in the latest price-sensitive company announcements or qualitative material. Simply Wall St has no position in any stocks mentioned.
Valuation is complex, but we're here to simplify it.
Discover if Tuya might be undervalued or overvalued with our detailed analysis, featuring fair value estimates, potential risks, dividends, insider trades, and its financial condition.
Access Free AnalysisHave feedback on this article? Concerned about the content? Get in touch with us directly. Alternatively, email editorial-team@simplywallst.com
About NYSE:TUYA
Tuya
Provides AI cloud platform services in the People’s Republic of China and internationally.
Flawless balance sheet with reasonable growth potential.
Market Insights


Advertisement
Community Narratives
A Quality Compounder Marked Down on Overblown Fears
Fair Value US$120.72|59.6% undervalued
BA
Community Contributor

Wyndham Continues Global Expansion with 19% Ancillary Revenue Growth
Fair Value US$105.80|20.8% undervalued
ZW
Community Contributor