Advertisement
- Japan
- /
- Healthcare Services
- /
- TSE:2374
Top Global Dividend Stocks To Consider In October 2025

Simply Wall St
Reviewed by Simply Wall St
In the current global market landscape, investors are navigating a complex environment characterized by economic uncertainty due to a U.S. government shutdown and fluctuating commodity prices. Despite these challenges, stock indices have shown resilience, with growth stocks leading the charge amid expectations of potential interest rate cuts by the Federal Reserve. In this context, dividend stocks can offer stability and income potential, making them an attractive option for those seeking to balance risk while capitalizing on market opportunities.
Top 10 Dividend Stocks Globally
| Name | Dividend Yield | Dividend Rating |
| Wuliangye YibinLtd (SZSE:000858) | 5.22% | ★★★★★★ |
| Scandinavian Tobacco Group (CPSE:STG) | 9.80% | ★★★★★★ |
| SAN Holdings (TSE:9628) | 3.87% | ★★★★★★ |
| NCD (TSE:4783) | 4.36% | ★★★★★★ |
| HUAYU Automotive Systems (SHSE:600741) | 3.90% | ★★★★★★ |
| Guangxi LiuYao Group (SHSE:603368) | 4.02% | ★★★★★★ |
| Daicel (TSE:4202) | 4.44% | ★★★★★★ |
| China South Publishing & Media Group (SHSE:601098) | 4.48% | ★★★★★★ |
| CAC Holdings (TSE:4725) | 4.60% | ★★★★★★ |
| Binggrae (KOSE:A005180) | 4.28% | ★★★★★★ |
Click here to see the full list of 1355 stocks from our Top Global Dividend Stocks screener.
Here we highlight a subset of our preferred stocks from the screener.
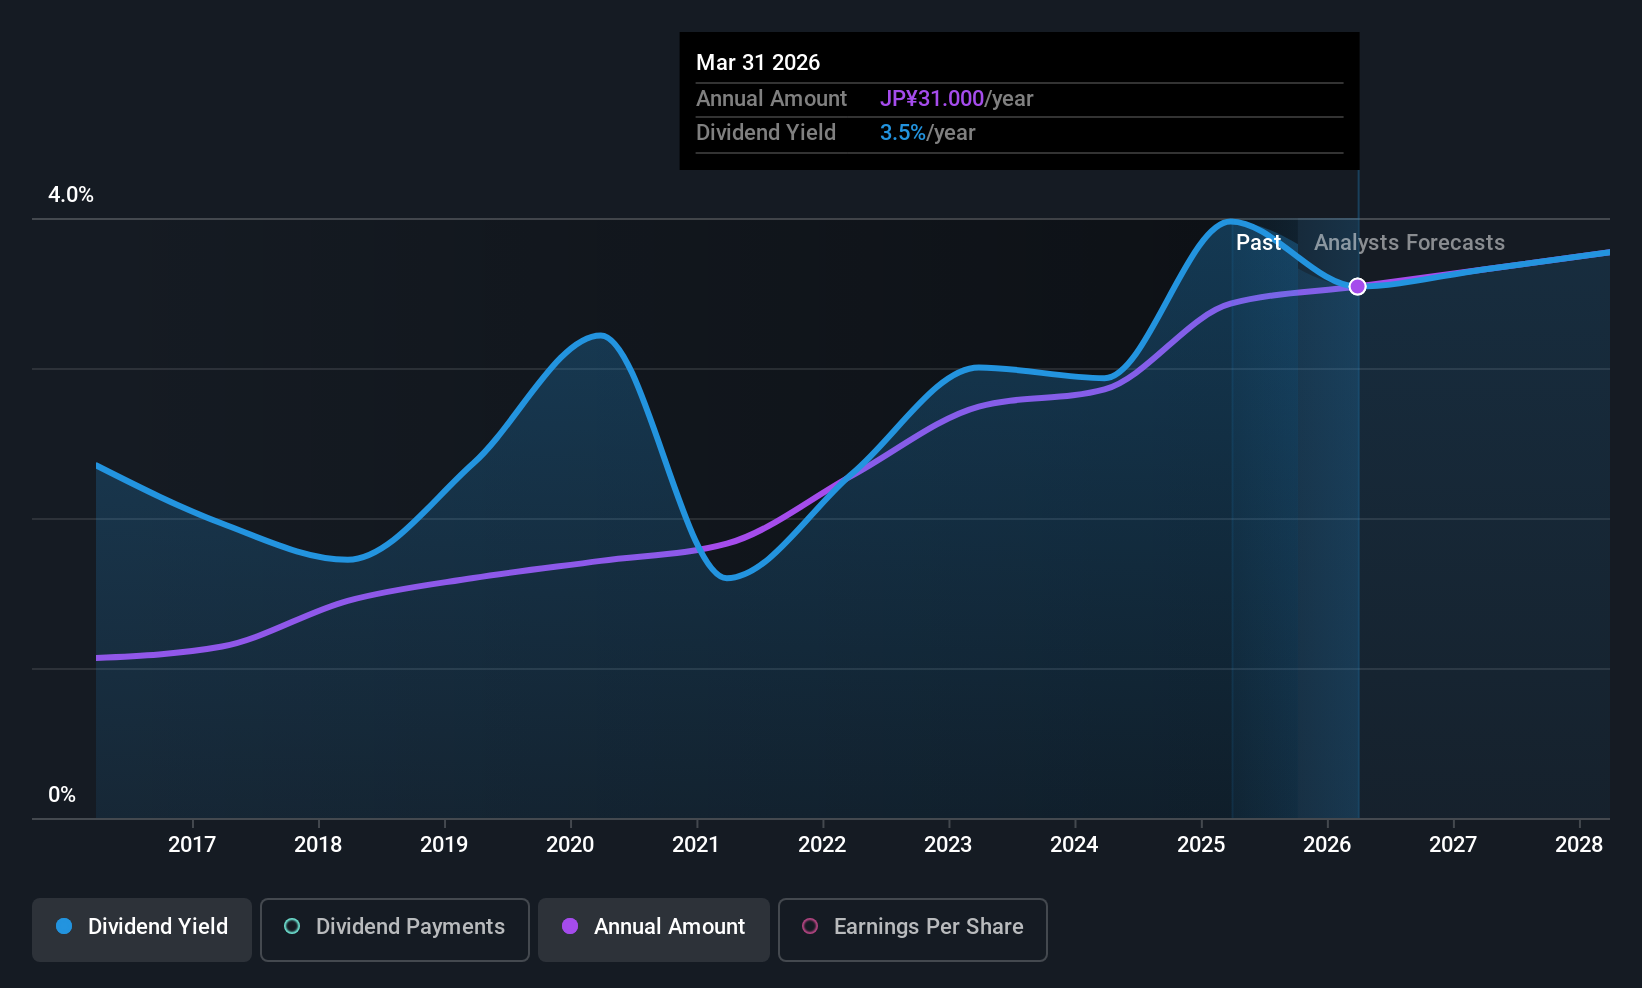
Saint-Care Holding (TSE:2374)
Simply Wall St Dividend Rating: ★★★★☆☆
Overview: Saint-Care Holding Corporation offers healthcare services in Japan and has a market cap of ¥19.47 billion.
Operations: Saint-Care Holding Corporation generates revenue primarily from its Nursing Care Service Business, which accounts for ¥55.85 billion.
Dividend Yield: 3.6%
Saint-Care Holding's dividend yield of 3.58% is slightly below the top tier in the JP market, and while dividends have been stable and growing over the past decade, they are not well covered by free cash flows due to a high cash payout ratio of 99.7%. The payout ratio of 42.8% suggests earnings cover dividends, but with earnings forecasted to decline by an average of 2.7% annually over three years, sustainability may be a concern.
- Take a closer look at Saint-Care Holding's potential here in our dividend report.
- According our valuation report, there's an indication that Saint-Care Holding's share price might be on the expensive side.
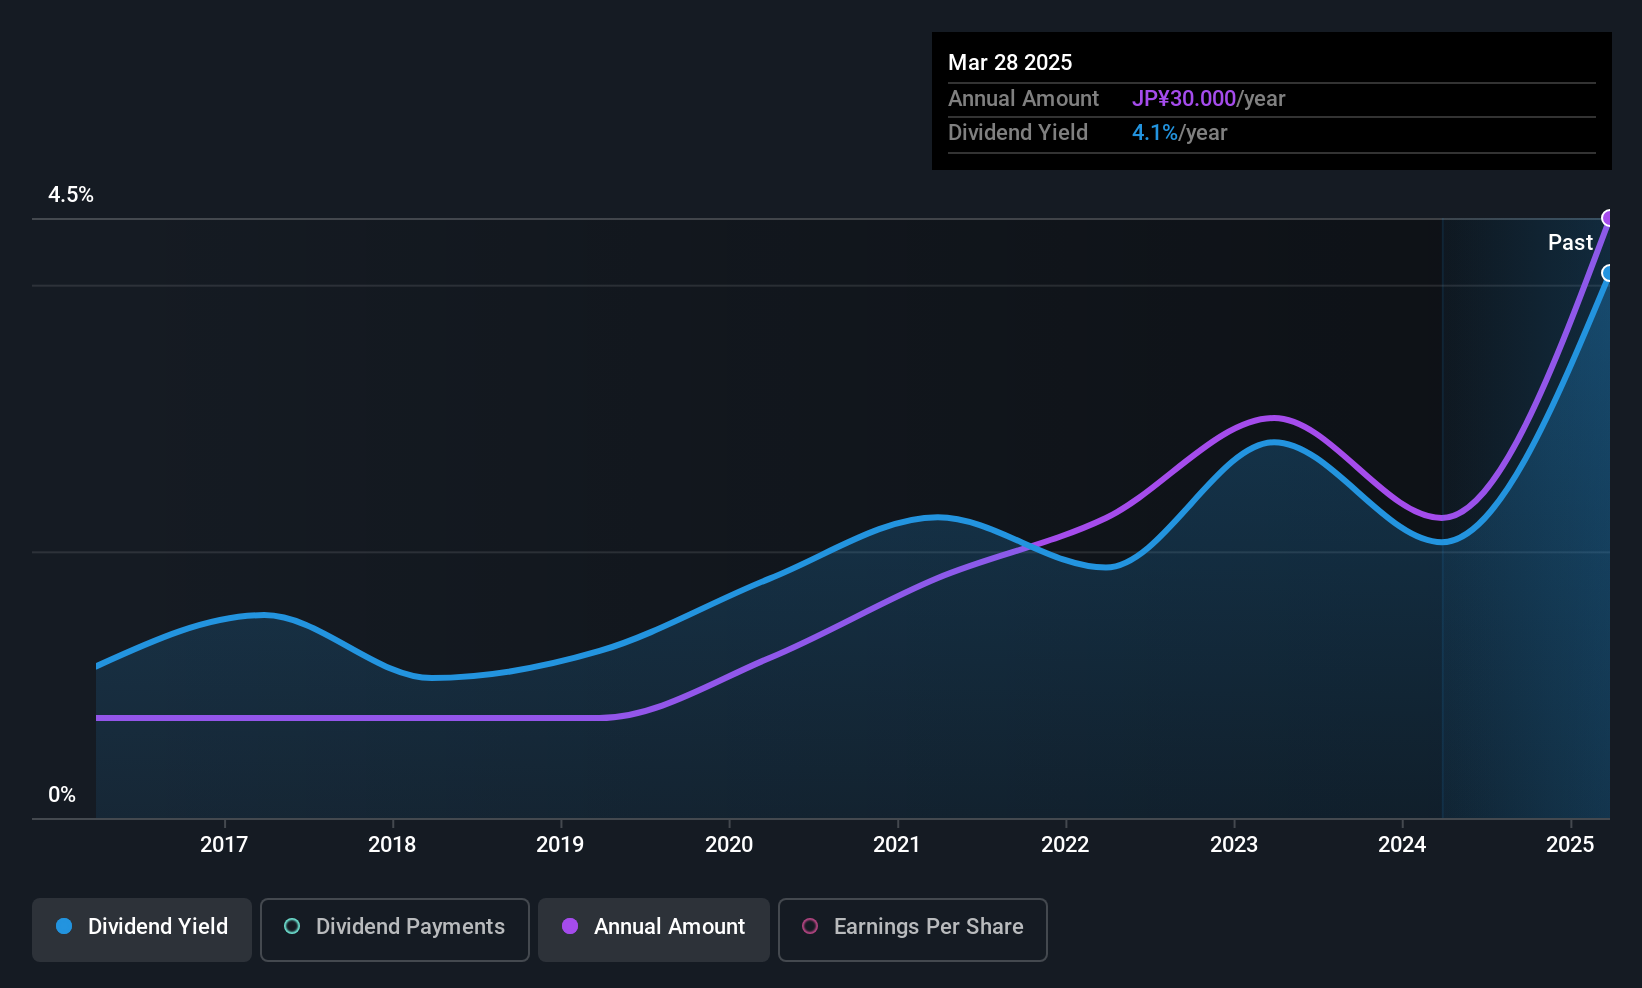
Kimura Chemical Plants (TSE:6378)
Simply Wall St Dividend Rating: ★★★★☆☆
Overview: Kimura Chemical Plants Co., Ltd. operates as an engineering company with a market cap of ¥19.31 billion.
Operations: Kimura Chemical Plants Co., Ltd. generates revenue through its Engineering Business with ¥7.76 billion, Chemical Engineering Business contributing ¥11.90 billion, and Energy and Environment Business adding ¥6.75 billion.
Dividend Yield: 3.6%
Kimura Chemical Plants offers a dividend yield of 3.64%, which is slightly below the top 25% of dividend payers in Japan. While dividends have grown over the past decade, their reliability is questionable due to volatility and an unstable track record. However, with a payout ratio of 47.7% and a cash payout ratio of 39.1%, dividends are well covered by both earnings and cash flows, indicating current sustainability despite past inconsistencies.
- Dive into the specifics of Kimura Chemical Plants here with our thorough dividend report.
- Our valuation report here indicates Kimura Chemical Plants may be undervalued.
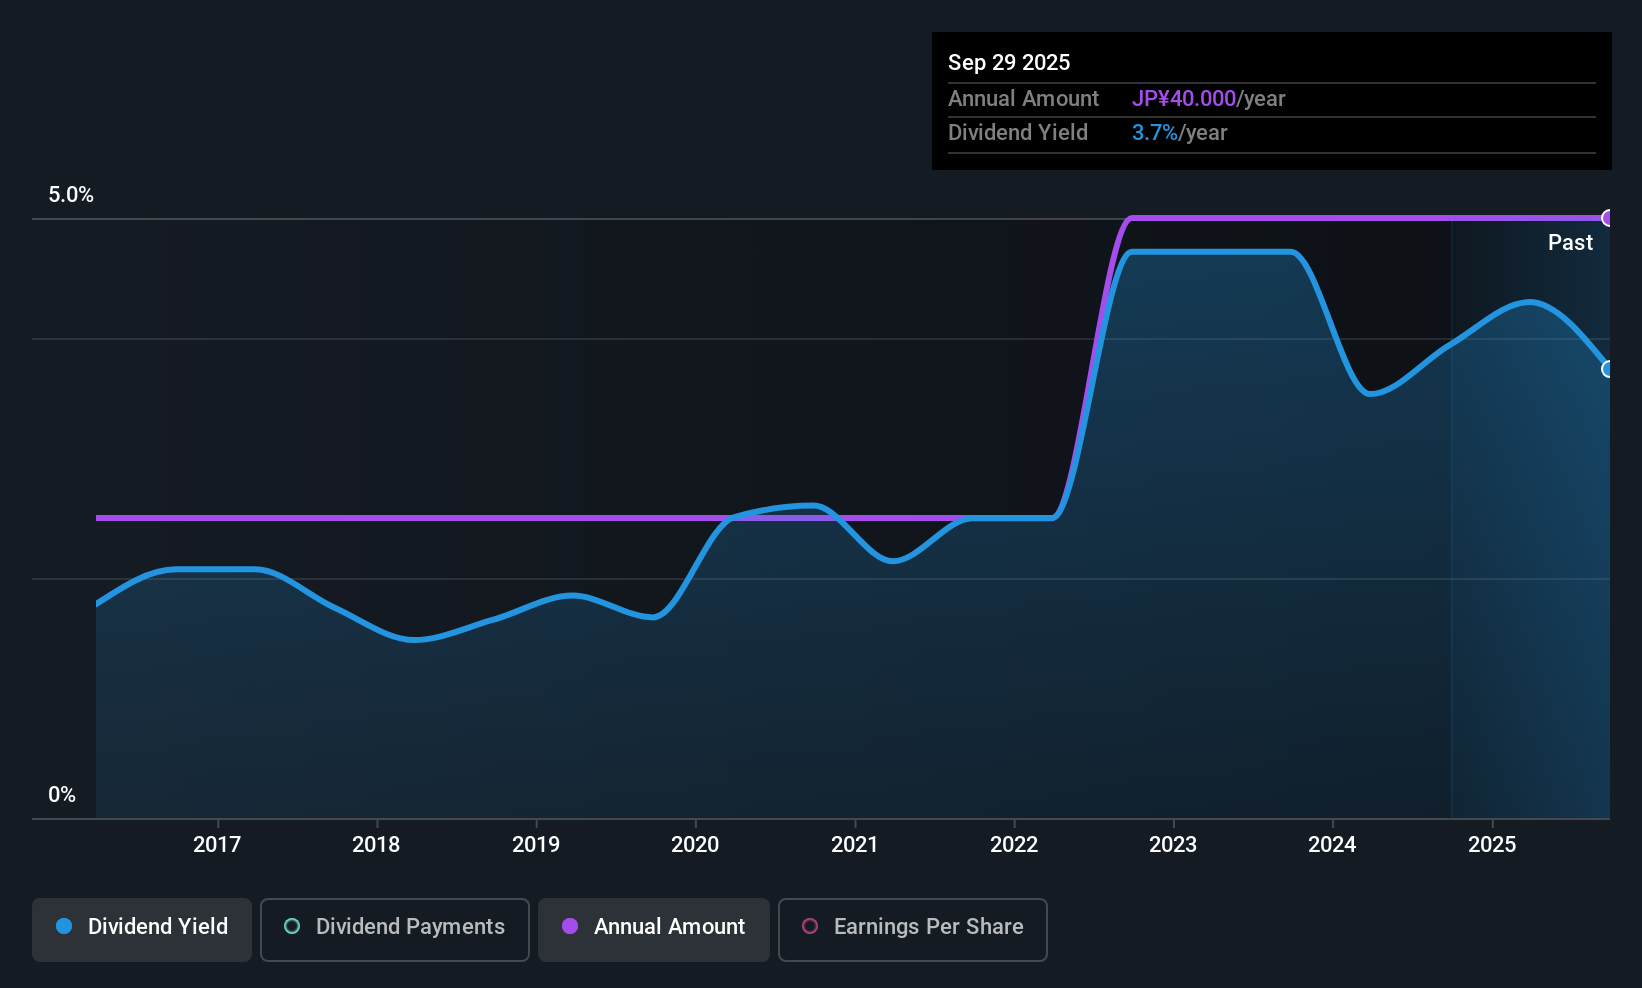
TOA (TSE:6809)
Simply Wall St Dividend Rating: ★★★★★☆
Overview: TOA Corporation manufactures and sells broadcasting, communications, and transmission equipment in Japan, with a market cap of ¥375.87 billion.
Operations: TOA Corporation generates revenue from several regions, including Japan (¥33.89 billion), the U.S.A. (¥2.74 billion), Asia-Pacific (¥10.09 billion), China & East Asia (¥1.90 billion), and Europe/Middle East/Africa (¥6.89 billion).
Dividend Yield: 3.1%
TOA Corporation's dividend yield of 3.11% is lower than the top 25% in Japan, yet it remains reliable with consistent growth over the past decade. The dividends are well-supported by a payout ratio of 48.2% and a cash payout ratio of 25.3%, indicating strong coverage by earnings and cash flows. Despite being dropped from the S&P Global BMI Index, TOA trades at a significant discount to its estimated fair value, which may appeal to value-focused investors.
- Unlock comprehensive insights into our analysis of TOA stock in this dividend report.
- According our valuation report, there's an indication that TOA's share price might be on the cheaper side.
Seize The Opportunity
- Click here to access our complete index of 1355 Top Global Dividend Stocks.
- Are any of these part of your asset mix? Tap into the analytical power of Simply Wall St's portfolio to get a 360-degree view on how they're shaping up.
- Simply Wall St is a revolutionary app designed for long-term stock investors, it's free and covers every market in the world.
Looking For Alternative Opportunities?
- Explore high-performing small cap companies that haven't yet garnered significant analyst attention.
- Fuel your portfolio with companies showing strong growth potential, backed by optimistic outlooks both from analysts and management.
- Find companies with promising cash flow potential yet trading below their fair value.
This article by Simply Wall St is general in nature. We provide commentary based on historical data and analyst forecasts only using an unbiased methodology and our articles are not intended to be financial advice. It does not constitute a recommendation to buy or sell any stock, and does not take account of your objectives, or your financial situation. We aim to bring you long-term focused analysis driven by fundamental data. Note that our analysis may not factor in the latest price-sensitive company announcements or qualitative material. Simply Wall St has no position in any stocks mentioned.
New: Manage All Your Stock Portfolios in One Place
We've created the ultimate portfolio companion for stock investors, and it's free.
• Connect an unlimited number of Portfolios and see your total in one currency
• Be alerted to new Warning Signs or Risks via email or mobile
• Track the Fair Value of your stocks
Have feedback on this article? Concerned about the content? Get in touch with us directly. Alternatively, email editorial-team@simplywallst.com
About TSE:2374
Flawless balance sheet average dividend payer.
Market Insights

Advertisement
Community Narratives
The Next Phase of Energy Storage: How NeoVolta Is Tackling America’s Power Crunch
Fair Value US$7.50|35.1% undervalued
MA
Community Contributor
Why EnSilica is Worth Possibly 13x its Current Price
Fair Value UK£5.00|89.8% undervalued
DO
Community Contributor
M&A Activity, Industry Diversification & A Defense Contract Monopoly Will Push BWXT For Healthy Long-Term Growth
Fair Value US$220.00|15.2% undervalued
CL
Community Contributor
A case for Cassiar Gold Corp (TSXV: GLDC) to reach CAD$8-10 before 2030 (X30-37)
Fair Value CA$10.00|96.0% undervalued
AG
Community Contributor