There's Reason For Concern Over Sutlej Textiles and Industries Limited's (NSE:SUTLEJTEX) Price


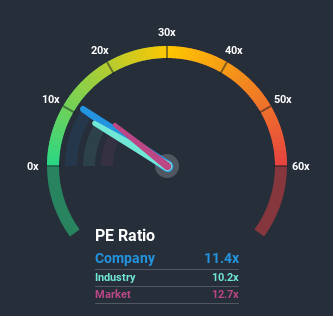
With a median price-to-earnings (or "P/E") ratio of close to 13x in India, you could be forgiven for feeling indifferent about Sutlej Textiles and Industries Limited's (NSE:SUTLEJTEX) P/E ratio of 11.4x. Although, it's not wise to simply ignore the P/E without explanation as investors may be disregarding a distinct opportunity or a costly mistake.
For example, consider that Sutlej Textiles and Industries' financial performance has been poor lately as it's earnings have been in decline. One possibility is that the P/E is moderate because investors think the company might still do enough to be in line with the broader market in the near future. If you like the company, you'd at least be hoping this is the case so that you could potentially pick up some stock while it's not quite in favour.
See our latest analysis for Sutlej Textiles and Industries
How Is Sutlej Textiles and Industries' Growth Trending?
The only time you'd be comfortable seeing a P/E like Sutlej Textiles and Industries' is when the company's growth is tracking the market closely.
Taking a look back first, the company's earnings per share growth last year wasn't something to get excited about as it posted a disappointing decline of 52%. This means it has also seen a slide in earnings over the longer-term as EPS is down 82% in total over the last three years. Accordingly, shareholders would have felt downbeat about the medium-term rates of earnings growth.
Weighing that medium-term earnings trajectory against the broader market's one-year forecast for a contraction of 2.5% shows the market is more attractive on an annualised basis regardless.
With this information, it's perhaps strange that Sutlej Textiles and Industries is trading at a fairly similar P/E in comparison. In general, when earnings shrink rapidly the P/E often shrinks too, which could set up shareholders for future disappointment. There's potential for the P/E to fall to lower levels if the company doesn't improve its profitability, which would be difficult to do with the current market outlook.
The Final Word
The price-to-earnings ratio's power isn't primarily as a valuation instrument but rather to gauge current investor sentiment and future expectations.
We've established that Sutlej Textiles and Industries currently trades on a higher than expected P/E since its recent three-year earnings are even worse than the forecasts for a struggling market. Right now we are uncomfortable with the P/E as this earnings performance isn't likely to support a more positive sentiment for long. We're also cautious about the company's ability to stay its recent medium-term course and resist even greater pain to its business from the broader market turmoil. Unless the company's relative performance improves, it's challenging to accept these prices as being reasonable.
You should always think about risks. Case in point, we've spotted 6 warning signs for Sutlej Textiles and Industries you should be aware of, and 2 of them are significant.
Of course, you might find a fantastic investment by looking at a few good candidates. So take a peek at this free list of companies with a strong growth track record, trading on a P/E below 20x.
If you decide to trade Sutlej Textiles and Industries, use the lowest-cost* platform that is rated #1 Overall by Barron’s, Interactive Brokers. Trade stocks, options, futures, forex, bonds and funds on 135 markets, all from a single integrated account. Promoted
If you're looking to trade Sutlej Textiles and Industries, open an account with the lowest-cost platform trusted by professionals, Interactive Brokers.
With clients in over 200 countries and territories, and access to 160 markets, IBKR lets you trade stocks, options, futures, forex, bonds and funds from a single integrated account.
Enjoy no hidden fees, no account minimums, and FX conversion rates as low as 0.03%, far better than what most brokers offer.
Sponsored ContentNew: Manage All Your Stock Portfolios in One Place
We've created the ultimate portfolio companion for stock investors, and it's free.
• Connect an unlimited number of Portfolios and see your total in one currency
• Be alerted to new Warning Signs or Risks via email or mobile
• Track the Fair Value of your stocks
This article by Simply Wall St is general in nature. It does not constitute a recommendation to buy or sell any stock, and does not take account of your objectives, or your financial situation. We aim to bring you long-term focused analysis driven by fundamental data. Note that our analysis may not factor in the latest price-sensitive company announcements or qualitative material. Simply Wall St has no position in any stocks mentioned.
*Interactive Brokers Rated Lowest Cost Broker by StockBrokers.com Annual Online Review 2020
Have feedback on this article? Concerned about the content? Get in touch with us directly. Alternatively, email editorial-team@simplywallst.com.
About NSEI:SUTLEJTEX
Sutlej Textiles and Industries
Designs, manufactures, and distributes textiles to wholesalers, manufacturers, and retailers for the home furnishing industry in India, Turkey, Bangladesh, the United States of America, Hong Kong, Singapore, and internationally.
Low and slightly overvalued.
Similar Companies
Market Insights

Community Narratives

