
Advertisement

Today we'll evaluate Lindsay Corporation (NYSE:LNN) to determine whether it could have potential as an investment idea. To be precise, we'll consider its Return On Capital Employed (ROCE), as that will inform our view of the quality of the business.
First, we'll go over how we calculate ROCE. Then we'll compare its ROCE to similar companies. Then we'll determine how its current liabilities are affecting its ROCE.
Understanding Return On Capital Employed (ROCE)
ROCE is a measure of a company's yearly pre-tax profit (its return), relative to the capital employed in the business. Generally speaking a higher ROCE is better. In brief, it is a useful tool, but it is not without drawbacks. Author Edwin Whiting says to be careful when comparing the ROCE of different businesses, since 'No two businesses are exactly alike.
So, How Do We Calculate ROCE?
Analysts use this formula to calculate return on capital employed:
Return on Capital Employed = Earnings Before Interest and Tax (EBIT) ÷ (Total Assets - Current Liabilities)
Or for Lindsay:
0.037 = US$16m ÷ (US$527m - US$85m) (Based on the trailing twelve months to November 2019.)
So, Lindsay has an ROCE of 3.7%.
View our latest analysis for Lindsay
Does Lindsay Have A Good ROCE?
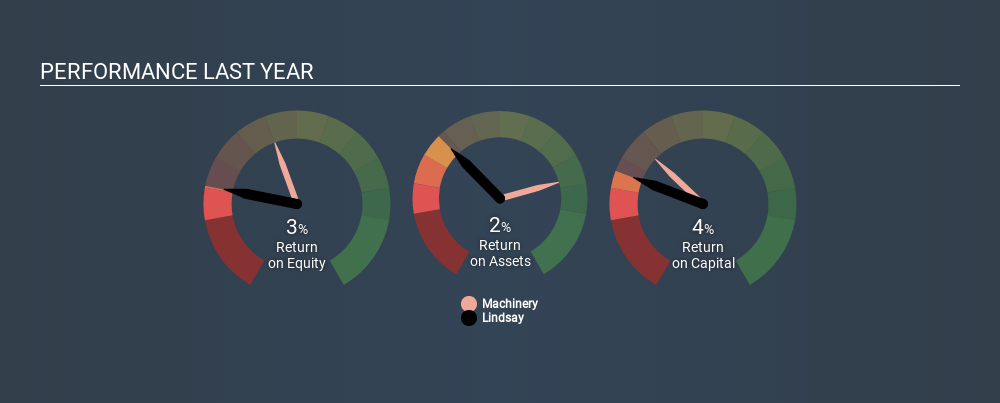
One way to assess ROCE is to compare similar companies. Using our data, Lindsay's ROCE appears to be significantly below the 11% average in the Machinery industry. This performance could be negative if sustained, as it suggests the business may underperform its industry. Regardless of how Lindsay stacks up against its industry, its ROCE in absolute terms is quite low (especially compared to a bank account). Readers may wish to look for more rewarding investments.
We can see that, Lindsay currently has an ROCE of 3.7%, less than the 6.4% it reported 3 years ago. So investors might consider if it has had issues recently. You can see in the image below how Lindsay's ROCE compares to its industry. Click to see more on past growth.
It is important to remember that ROCE shows past performance, and is not necessarily predictive. Companies in cyclical industries can be difficult to understand using ROCE, as returns typically look high during boom times, and low during busts. ROCE is, after all, simply a snap shot of a single year. Future performance is what matters, and you can see analyst predictions in our free report on analyst forecasts for the company.
Lindsay's Current Liabilities And Their Impact On Its ROCE
Liabilities, such as supplier bills and bank overdrafts, are referred to as current liabilities if they need to be paid within 12 months. Due to the way ROCE is calculated, a high level of current liabilities makes a company look as though it has less capital employed, and thus can (sometimes unfairly) boost the ROCE. To counter this, investors can check if a company has high current liabilities relative to total assets.
Lindsay has current liabilities of US$85m and total assets of US$527m. Therefore its current liabilities are equivalent to approximately 16% of its total assets. This is a modest level of current liabilities, which will have a limited impact on the ROCE.
What We Can Learn From Lindsay's ROCE
That's not a bad thing, however Lindsay has a weak ROCE and may not be an attractive investment. Of course, you might find a fantastic investment by looking at a few good candidates. So take a peek at this free list of companies with modest (or no) debt, trading on a P/E below 20.
If you are like me, then you will not want to miss this free list of growing companies that insiders are buying.
If you spot an error that warrants correction, please contact the editor at editorial-team@simplywallst.com. This article by Simply Wall St is general in nature. It does not constitute a recommendation to buy or sell any stock, and does not take account of your objectives, or your financial situation. Simply Wall St has no position in the stocks mentioned.
We aim to bring you long-term focused research analysis driven by fundamental data. Note that our analysis may not factor in the latest price-sensitive company announcements or qualitative material. Thank you for reading.
About NYSE:LNN
Lindsay
Provides water management and road infrastructure products and services in the United States and internationally.
Flawless balance sheet average dividend payer.
Similar Companies
Market Insights


Advertisement
Community Narratives
For the Emperor: Why Games Workshop Could Be a Star Investment
Fair Value UK£160.00|0.5% overvalued
RO
Community Contributor
Securitas will boost margins with AI and tech-driven services
Fair Value SEK 260.91|44.9% undervalued
UN
Community Contributor
A Leader in EV Charging with Growth Potential
Fair Value €27.00|21.3% undervalued
TI
Community Contributor