
Advertisement

Today we'll look at GAIL (India) Limited (NSE:GAIL) and reflect on its potential as an investment. In particular, we'll consider its Return On Capital Employed (ROCE), as that can give us insight into how profitably the company is able to employ capital in its business.
Firstly, we'll go over how we calculate ROCE. Second, we'll look at its ROCE compared to similar companies. Then we'll determine how its current liabilities are affecting its ROCE.
Return On Capital Employed (ROCE): What is it?
ROCE measures the amount of pre-tax profits a company can generate from the capital employed in its business. All else being equal, a better business will have a higher ROCE. Ultimately, it is a useful but imperfect metric. Renowned investment researcher Michael Mauboussin has suggested that a high ROCE can indicate that 'one dollar invested in the company generates value of more than one dollar'.
So, How Do We Calculate ROCE?
Analysts use this formula to calculate return on capital employed:
Return on Capital Employed = Earnings Before Interest and Tax (EBIT) ÷ (Total Assets - Current Liabilities)
Or for GAIL (India):
0.14 = ₹83b ÷ (₹684b - ₹107b) (Based on the trailing twelve months to June 2019.)
Therefore, GAIL (India) has an ROCE of 14%.
Check out our latest analysis for GAIL (India)
Does GAIL (India) Have A Good ROCE?
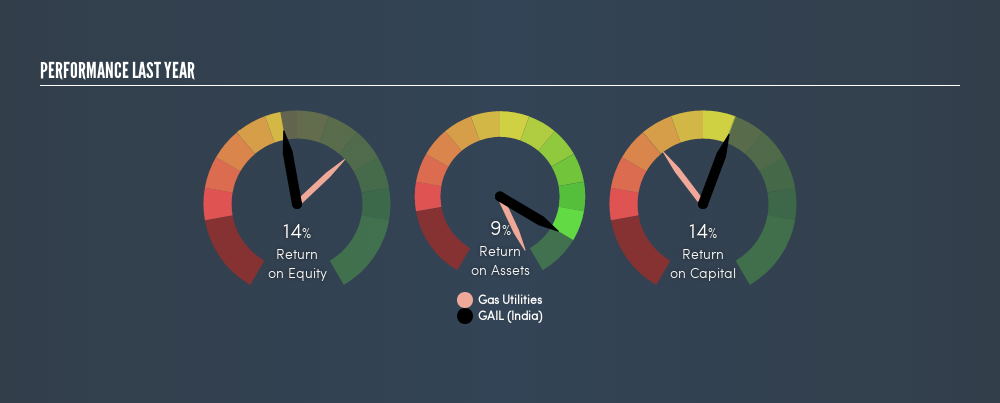
ROCE is commonly used for comparing the performance of similar businesses. In this analysis, GAIL (India)'s ROCE appears meaningfully below the 23% average reported by the Gas Utilities industry. This could be seen as a negative, as it suggests some competitors may be employing their capital more efficiently. Separate from how GAIL (India) stacks up against its industry, its ROCE in absolute terms is mediocre; relative to the returns on government bonds. Investors may wish to consider higher-performing investments.
We can see that, GAIL (India) currently has an ROCE of 14% compared to its ROCE 3 years ago, which was 7.5%. This makes us think about whether the company has been reinvesting shrewdly.
Remember that this metric is backwards looking - it shows what has happened in the past, and does not accurately predict the future. Companies in cyclical industries can be difficult to understand using ROCE, as returns typically look high during boom times, and low during busts. ROCE is only a point-in-time measure. Since the future is so important for investors, you should check out our free report on analyst forecasts for GAIL (India).
GAIL (India)'s Current Liabilities And Their Impact On Its ROCE
Current liabilities are short term bills and invoices that need to be paid in 12 months or less. The ROCE equation subtracts current liabilities from capital employed, so a company with a lot of current liabilities appears to have less capital employed, and a higher ROCE than otherwise. To counter this, investors can check if a company has high current liabilities relative to total assets.
GAIL (India) has total liabilities of ₹107b and total assets of ₹684b. Therefore its current liabilities are equivalent to approximately 16% of its total assets. This very reasonable level of current liabilities would not boost the ROCE by much.
The Bottom Line On GAIL (India)'s ROCE
With that in mind, we're not overly impressed with GAIL (India)'s ROCE, so it may not be the most appealing prospect. Of course, you might also be able to find a better stock than GAIL (India). So you may wish to see this free collection of other companies that have grown earnings strongly.
For those who like to find winning investments this free list of growing companies with recent insider purchasing, could be just the ticket.
We aim to bring you long-term focused research analysis driven by fundamental data. Note that our analysis may not factor in the latest price-sensitive company announcements or qualitative material.
If you spot an error that warrants correction, please contact the editor at editorial-team@simplywallst.com. This article by Simply Wall St is general in nature. It does not constitute a recommendation to buy or sell any stock, and does not take account of your objectives, or your financial situation. Simply Wall St has no position in the stocks mentioned. Thank you for reading.
About NSEI:GAIL
GAIL (India)
Operates as a natural gas processing and distribution company in India and internationally.
Solid track record established dividend payer.
Similar Companies
Market Insights


Advertisement
Community Narratives
For the Emperor: Why Games Workshop Could Be a Star Investment
Fair Value UK£160.00|0.4% overvalued
RO
Community Contributor
Securitas will boost margins with AI and tech-driven services
Fair Value SEK 260.91|44.5% undervalued
UN
Community Contributor
A Leader in EV Charging with Growth Potential
Fair Value €27.00|17.8% undervalued
TI
Community Contributor