Advertisement
Should You Like Kelso Technologies Inc.’s (TSE:KLS) High Return On Capital Employed?
Today we'll evaluate Kelso Technologies Inc. (TSE:KLS) to determine whether it could have potential as an investment idea. Specifically, we'll consider its Return On Capital Employed (ROCE), since that will give us an insight into how efficiently the business can generate profits from the capital it requires.
First up, we'll look at what ROCE is and how we calculate it. Second, we'll look at its ROCE compared to similar companies. Last but not least, we'll look at what impact its current liabilities have on its ROCE.
What is Return On Capital Employed (ROCE)?
ROCE measures the 'return' (pre-tax profit) a company generates from capital employed in its business. All else being equal, a better business will have a higher ROCE. Ultimately, it is a useful but imperfect metric. Author Edwin Whiting says to be careful when comparing the ROCE of different businesses, since 'No two businesses are exactly alike.
So, How Do We Calculate ROCE?
Analysts use this formula to calculate return on capital employed:
Return on Capital Employed = Earnings Before Interest and Tax (EBIT) ÷ (Total Assets - Current Liabilities)
Or for Kelso Technologies:
0.25 = US$3.3m ÷ (US$16m - US$2.9m) (Based on the trailing twelve months to March 2020.)
Therefore, Kelso Technologies has an ROCE of 25%.
Check out our latest analysis for Kelso Technologies
Does Kelso Technologies Have A Good ROCE?
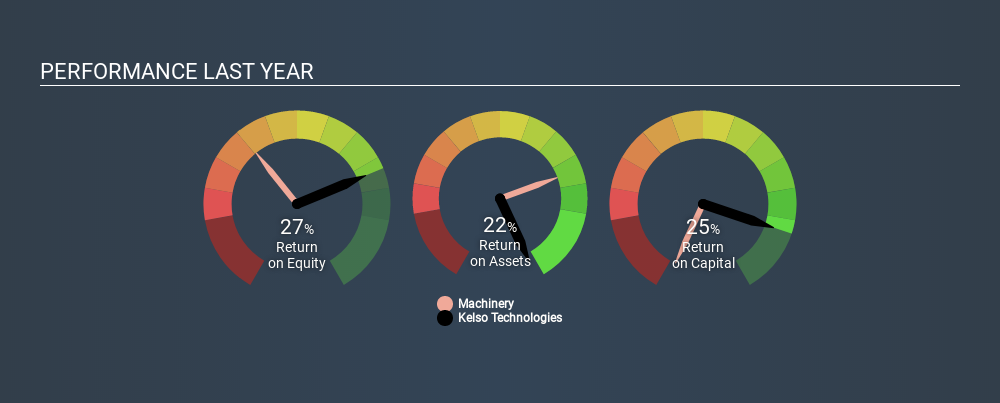
ROCE can be useful when making comparisons, such as between similar companies. Kelso Technologies's ROCE appears to be substantially greater than the 10% average in the Machinery industry. We consider this a positive sign, because it suggests it uses capital more efficiently than similar companies. Putting aside its position relative to its industry for now, in absolute terms, Kelso Technologies's ROCE is currently very good.
Kelso Technologies reported an ROCE of 25% -- better than 3 years ago, when the company didn't make a profit. This makes us wonder if the company is improving. The image below shows how Kelso Technologies's ROCE compares to its industry, and you can click it to see more detail on its past growth.
It is important to remember that ROCE shows past performance, and is not necessarily predictive. ROCE can be misleading for companies in cyclical industries, with returns looking impressive during the boom times, but very weak during the busts. This is because ROCE only looks at one year, instead of considering returns across a whole cycle. If Kelso Technologies is cyclical, it could make sense to check out this free graph of past earnings, revenue and cash flow.
Kelso Technologies's Current Liabilities And Their Impact On Its ROCE
Liabilities, such as supplier bills and bank overdrafts, are referred to as current liabilities if they need to be paid within 12 months. Due to the way ROCE is calculated, a high level of current liabilities makes a company look as though it has less capital employed, and thus can (sometimes unfairly) boost the ROCE. To counter this, investors can check if a company has high current liabilities relative to total assets.
Kelso Technologies has total assets of US$16m and current liabilities of US$2.9m. Therefore its current liabilities are equivalent to approximately 18% of its total assets. A minimal amount of current liabilities limits the impact on ROCE.
The Bottom Line On Kelso Technologies's ROCE
, There might be better investments than Kelso Technologies out there, but you will have to work hard to find them . These promising businesses with rapidly growing earnings might be right up your alley.
I will like Kelso Technologies better if I see some big insider buys. While we wait, check out this free list of growing companies with considerable, recent, insider buying.
Love or hate this article? Concerned about the content? Get in touch with us directly. Alternatively, email editorial-team@simplywallst.com.
This article by Simply Wall St is general in nature. It does not constitute a recommendation to buy or sell any stock, and does not take account of your objectives, or your financial situation. We aim to bring you long-term focused analysis driven by fundamental data. Note that our analysis may not factor in the latest price-sensitive company announcements or qualitative material. Simply Wall St has no position in any stocks mentioned. Thank you for reading.
About TSX:KLS
Kelso Technologies
Designs, engineers, markets, produces and distributes various proprietary pressure relief valves in the United States.
Adequate balance sheet and slightly overvalued.
Market Insights


Advertisement
Weekly Picks
LO


Lou_Basenese on Cue Biopharma ·
Cue Biopharma (NASDAQ: CUE): The Scientist Behind Xolair Just Gave Cue a Next-Generation Shot at the Same Multi-Billion-Dollar Market
Fair Value:US$7063.2% undervalued
43 followersusers have followed this narrative
0 commentsusers have commented on this narrative
9 likesusers have liked this narrative
HA


HarishPK on Adobe ·
Adobe: A Probabilistic Case for Undervaluation
Fair Value:US$319.9635.5% undervalued
47 followersusers have followed this narrative
8 commentsusers have commented on this narrative
17 likesusers have liked this narrative
NI


niteco on Broadcom ·
A Capital Allocation Favorite with Structural Importance
Fair Value:US$651.0539.5% undervalued
45 followersusers have followed this narrative
0 commentsusers have commented on this narrative
8 likesusers have liked this narrative
TO


Tokyo on Okta ·
Good foundation, but now it's all about the next steps
Fair Value:US$15121.8% undervalued
91 followersusers have followed this narrative
7 commentsusers have commented on this narrative
11 likesusers have liked this narrative
Recently Updated Narratives
RO


RockeTeller on Investigator Silver ·
Investigator Silver, Leverage Exposed: $1/oz Move = $42M Cash for This ASX Developer
Fair Value:AU$2.3997.7% undervalued
15 followersusers have followed this narrative
0 commentsusers have commented on this narrative
1 likeusers have liked this narrative
TA


Talos on Voyager Technologies ·
The "Landlord of Orbit" – A Deep Value Play Ahead of the Starlab Era
Fair Value:US$385.289.5% undervalued
17 followersusers have followed this narrative
0 commentsusers have commented on this narrative
0 likesusers have liked this narrative
TA

Talos on Advanced Micro Devices ·
The "David vs. Goliath" AI Trade – Why Second Place is Worth Billions
Fair Value:US$907.3239.7% undervalued
37 followersusers have followed this narrative
1 commentusers have commented on this narrative
0 likesusers have liked this narrative
Popular Narratives
MA


martinarauz on Nu Holdings ·
Investment Analysis (May 2026)
Fair Value:US$22.7445.3% undervalued
66 followersusers have followed this narrative
0 commentsusers have commented on this narrative
16 likesusers have liked this narrative
NI

niteco on Honeywell International ·
Honeywell - The Demand-Side of the AI Infrastructure
Fair Value:US$320.1929.0% undervalued
51 followersusers have followed this narrative
0 commentsusers have commented on this narrative
19 likesusers have liked this narrative
CL


Clive_Thompson on Take-Two Interactive Software ·
Take-Two Interactive: The Calm Before the Storm NASDAQ: TTWO Last Price: $242.41 Date: May 15, 2026
Fair Value:US$276.9721.9% undervalued
58 followersusers have followed this narrative
0 commentsusers have commented on this narrative
14 likesusers have liked this narrative
