
Advertisement

Today we'll take a closer look at Stolt-Nielsen Limited (OB:SNI) from a dividend investor's perspective. Owning a strong business and reinvesting the dividends is widely seen as an attractive way of growing your wealth. Unfortunately, it's common for investors to be enticed in by the seemingly attractive yield, and lose money when the company has to cut its dividend payments.
So you might want to consider getting our latest analysis on Stolt-Nielsen's financial health here.
In this case, Stolt-Nielsen likely looks attractive to investors, given its 4.0% dividend yield and a payment history of over ten years. We'd guess that plenty of investors have purchased it for the income. During the year, the company also conducted a buyback equivalent to around 0.6% of its market capitalisation. Some simple analysis can offer a lot of insights when buying a company for its dividend, and we'll go through this below.
Click the interactive chart for our full dividend analysis
Payout ratios
Dividends are usually paid out of company earnings. If a company is paying more than it earns, then the dividend might become unsustainable - hardly an ideal situation. So we need to form a view on if a company's dividend is sustainable, relative to its net profit after tax. In the last year, Stolt-Nielsen paid out 162% of its profit as dividends. A payout ratio above 100% is definitely an item of concern, unless there are some other circumstances that would justify it.
Another important check we do is to see if the free cash flow generated is sufficient to pay the dividend. Stolt-Nielsen's cash payout ratio last year was 19%. Cash flows are typically lumpy, but this looks like an appropriately conservative payout. It's good to see that while Stolt-Nielsen's dividends were not covered by profits, at least they are affordable from a cash perspective. Still, if the company repeatedly paid a dividend greater than its profits, we'd be concerned. Very few companies are able to sustainably pay dividends larger than their reported earnings.
Is Stolt-Nielsen's Balance Sheet Risky?
As Stolt-Nielsen's dividend was not well covered by earnings, we need to check its balance sheet for signs of financial distress. A quick check of its financial situation can be done with two ratios: net debt divided by EBITDA (earnings before interest, tax, depreciation and amortisation), and net interest cover. Net debt to EBITDA measures total debt load relative to company earnings (lower = less debt), while net interest cover measures the ability to pay interest on the debt (higher = greater ability to pay interest costs). With net debt of 5.77 times its EBITDA, Stolt-Nielsen could be described as a highly leveraged company. While some companies can handle this level of leverage, we'd be concerned about the dividend sustainability if there was any risk of an earnings downturn.
We calculated its interest cover by measuring its earnings before interest and tax (EBIT), and dividing this by the company's net interest expense. With EBIT of 1.02 times its interest expense, Stolt-Nielsen's interest cover is starting to look a bit thin. Low interest cover and high debt can create problems right when the investor least needs them, and we're reluctant to rely on the dividend of companies with these traits.
Dividend Volatility
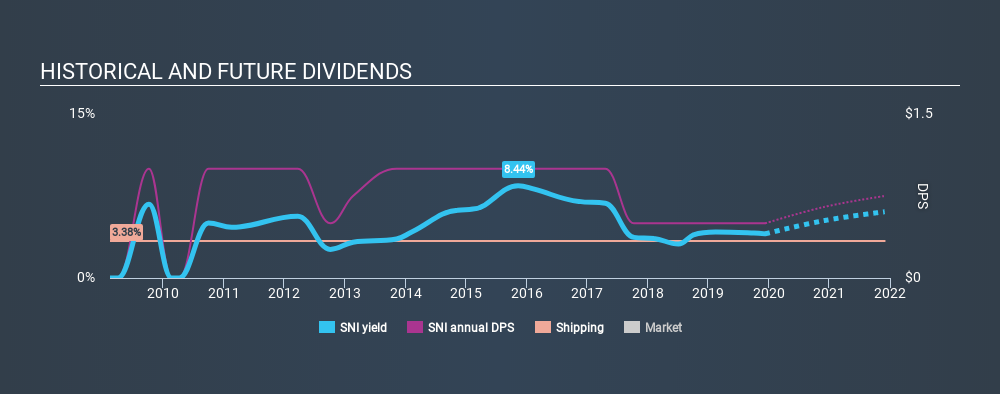
Before buying a stock for its income, we want to see if the dividends have been stable in the past, and if the company has a track record of maintaining its dividend. For the purpose of this article, we only scrutinise the last decade of Stolt-Nielsen's dividend payments. This dividend has been unstable, which we define as having fallen by at least 20% one or more times over this time. During the past ten-year period, the first annual payment was US$1.00 in 2009, compared to US$0.50 last year. This works out to be a decline of approximately 6.7% per year over that time. Stolt-Nielsen's dividend has been cut sharply at least once, so it hasn't fallen by 6.7% every year, but this is a decent approximation of the long term change.
We struggle to make a case for buying Stolt-Nielsen for its dividend, given that payments have shrunk over the past ten years.
Dividend Growth Potential
With a relatively unstable dividend, and a poor history of shrinking dividends, it's even more important to see if EPS are growing. Stolt-Nielsen's earnings per share have shrunk at 26% a year over the past five years. With this kind of significant decline, we always wonder what has changed in the business. Dividends are about stability, and Stolt-Nielsen's earnings per share, which support the dividend, have been anything but stable.
Conclusion
When we look at a dividend stock, we need to form a judgement on whether the dividend will grow, if the company is able to maintain it in a wide range of economic circumstances, and if the dividend payout is sustainable. We're a bit uncomfortable with its high payout ratio, although at least the dividend was covered by free cash flow. Earnings per share are down, and Stolt-Nielsen's dividend has been cut at least once in the past, which is disappointing. In summary, Stolt-Nielsen has a number of shortcomings that we'd find it hard to get past. Things could change, but we think there are likely more attractive alternatives out there.
Given that earnings are not growing, the dividend does not look nearly so attractive. Businesses can change though, and we think it would make sense to see what analysts are forecasting for the company.
We have also put together a list of global stocks with a market capitalisation above $1bn and yielding more 3%.
If you spot an error that warrants correction, please contact the editor at editorial-team@simplywallst.com. This article by Simply Wall St is general in nature. It does not constitute a recommendation to buy or sell any stock, and does not take account of your objectives, or your financial situation. Simply Wall St has no position in the stocks mentioned.
We aim to bring you long-term focused research analysis driven by fundamental data. Note that our analysis may not factor in the latest price-sensitive company announcements or qualitative material. Thank you for reading.
About OB:SNI
Stolt-Nielsen
Provides transportation, storage, and distribution solutions for bulk liquid chemicals, edible oils, acids, and other specialty liquids worldwide.
Undervalued average dividend payer.
Similar Companies
Market Insights


Advertisement
Community Narratives
The Future of Drug Testing? Fingerprint Tech Shows Serious Promise
Fair Value US$2.98|43.0% undervalued
JO
Community Contributor
Suncorp’s Next Chapter: Insurance-Only and Ready to Grow
Fair Value AU$22.83|7.6% undervalued
RO
Community Contributor
Thyssenkrupp Nucera Will Achieve Double-Digit Profits by 2030 Boosted by Hydrogen Growth
Fair Value €14.40|30.6% undervalued
CH
Community Contributor
Tesla’s Nvidia Moment – The AI & Robotics Inflection Point
Fair Value US$359.72|18.3% undervalued
BL
Community Contributor