
Advertisement

Dividend paying stocks like Smiths Group plc (LON:SMIN) tend to be popular with investors, and for good reason - some research suggests a significant amount of all stock market returns come from reinvested dividends. Unfortunately, it's common for investors to be enticed in by the seemingly attractive yield, and lose money when the company has to cut its dividend payments.
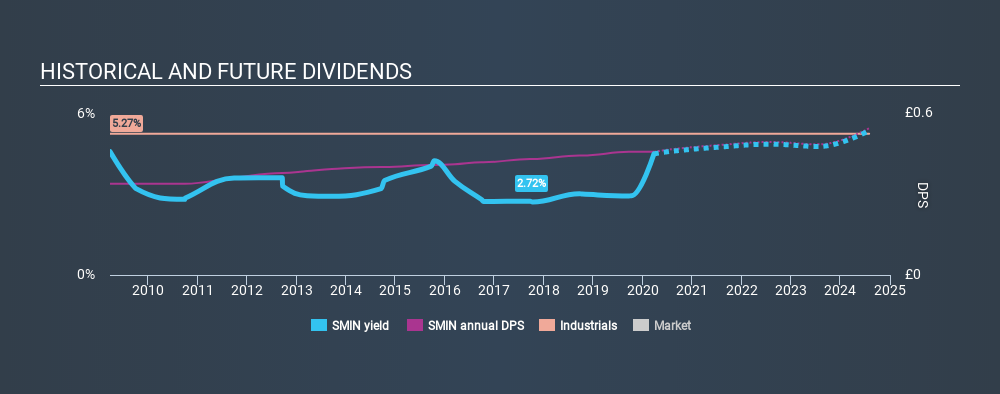
With Smiths Group yielding 4.5% and having paid a dividend for over 10 years, many investors likely find the company quite interesting. It would not be a surprise to discover that many investors buy it for the dividends. Remember that the recent share price drop will make Smiths Group's yield look higher, even though recent events might have impacted the company's prospects. Some simple analysis can offer a lot of insights when buying a company for its dividend, and we'll go through this below.
Explore this interactive chart for our latest analysis on Smiths Group!
Payout ratios
Companies (usually) pay dividends out of their earnings. If a company is paying more than it earns, the dividend might have to be cut. Comparing dividend payments to a company's net profit after tax is a simple way of reality-checking whether a dividend is sustainable. In the last year, Smiths Group paid out 130% of its profit as dividends. A payout ratio above 100% is definitely an item of concern, unless there are some other circumstances that would justify it.
Another important check we do is to see if the free cash flow generated is sufficient to pay the dividend. Smiths Group paid out 78% of its cash flow last year. This may be sustainable but it does not leave much of a buffer for unexpected circumstances. It's good to see that while Smiths Group's dividends were not covered by profits, at least they are affordable from a cash perspective. If executives were to continue paying more in dividends than the company reported in profits, we'd view this as a warning sign. Extraordinarily few companies are capable of persistently paying a dividend that is greater than their profits.
Is Smiths Group's Balance Sheet Risky?
As Smiths Group's dividend was not well covered by earnings, we need to check its balance sheet for signs of financial distress. A rough way to check this is with these two simple ratios: a) net debt divided by EBITDA (earnings before interest, tax, depreciation and amortisation), and b) net interest cover. Net debt to EBITDA measures total debt load relative to company earnings (lower = less debt), while net interest cover measures the ability to pay interest on the debt (higher = greater ability to pay interest costs). Smiths Group has net debt of 2.45 times its EBITDA. Using debt can accelerate business growth, but also increases the risks.
We calculated its interest cover by measuring its earnings before interest and tax (EBIT), and dividing this by the company's net interest expense. Net interest cover of 7.78 times its interest expense appears reasonable for Smiths Group, although we're conscious that even high interest cover doesn't make a company bulletproof.
Consider getting our latest analysis on Smiths Group's financial position here.
Dividend Volatility
Before buying a stock for its income, we want to see if the dividends have been stable in the past, and if the company has a track record of maintaining its dividend. For the purpose of this article, we only scrutinise the last decade of Smiths Group's dividend payments. During this period the dividend has been stable, which could imply the business could have relatively consistent earnings power. During the past ten-year period, the first annual payment was UK£0.34 in 2010, compared to UK£0.46 last year. This works out to be a compound annual growth rate (CAGR) of approximately 3.0% a year over that time.
While the consistency in the dividend payments is impressive, we think the relatively slow rate of growth is unappealing.
Dividend Growth Potential
Dividend payments have been consistent over the past few years, but we should always check if earnings per share (EPS) are growing, as this will help maintain the purchasing power of the dividend. It's not great to see that Smiths Group's have fallen at approximately 9.8% over the past five years. Declining earnings per share over a number of years is not a great sign for the dividend investor. Without some improvement, this does not bode well for the long term value of a company's dividend.
Conclusion
Dividend investors should always want to know if a) a company's dividends are affordable, b) if there is a track record of consistent payments, and c) if the dividend is capable of growing. We're not keen on the fact that Smiths Group paid out such a high percentage of its income, although its cashflow is in better shape. Moreover, earnings have been shrinking. While the dividends have been fairly steady, we'd wonder for how much longer this will be sustainable if earnings continue to decline. With this information in mind, we think Smiths Group may not be an ideal dividend stock.
Market movements attest to how highly valued a consistent dividend policy is to one to which is more unpredictable. Still, investors need to consider a host of other factors, apart from dividend payments, when analysing a company. Taking the debate a bit further, we've identified 3 warning signs for Smiths Group that investors need to be conscious of moving forward.
If you are a dividend investor, you might also want to look at our curated list of dividend stocks yielding above 3%.
If you spot an error that warrants correction, please contact the editor at editorial-team@simplywallst.com. This article by Simply Wall St is general in nature. It does not constitute a recommendation to buy or sell any stock, and does not take account of your objectives, or your financial situation. Simply Wall St has no position in the stocks mentioned.
We aim to bring you long-term focused research analysis driven by fundamental data. Note that our analysis may not factor in the latest price-sensitive company announcements or qualitative material. Thank you for reading.
About LSE:SMIN
Smiths Group
Operates as an industrial technology company in Americas, Europe, the Asia Pacific, and internationally.
Flawless balance sheet with solid track record.
Similar Companies
Market Insights


Advertisement
Community Narratives
The Future of Drug Testing? Fingerprint Tech Shows Serious Promise
Fair Value US$2.98|40.3% undervalued
JO
Community Contributor
Suncorp’s Next Chapter: Insurance-Only and Ready to Grow
Fair Value AU$22.83|8.8% undervalued
RO
Community Contributor
Thyssenkrupp Nucera Will Achieve Double-Digit Profits by 2030 Boosted by Hydrogen Growth
Fair Value €14.40|31.3% undervalued
CH
Community Contributor
Tesla’s Nvidia Moment – The AI & Robotics Inflection Point
Fair Value US$384.84|18.1% undervalued
BL
Community Contributor