
Advertisement
- Australia
- /
- Metals and Mining
- /
- ASX:PRG
Should You Be Tempted To Sell CI Resources Limited (ASX:CII) Because Of Its P/E Ratio?

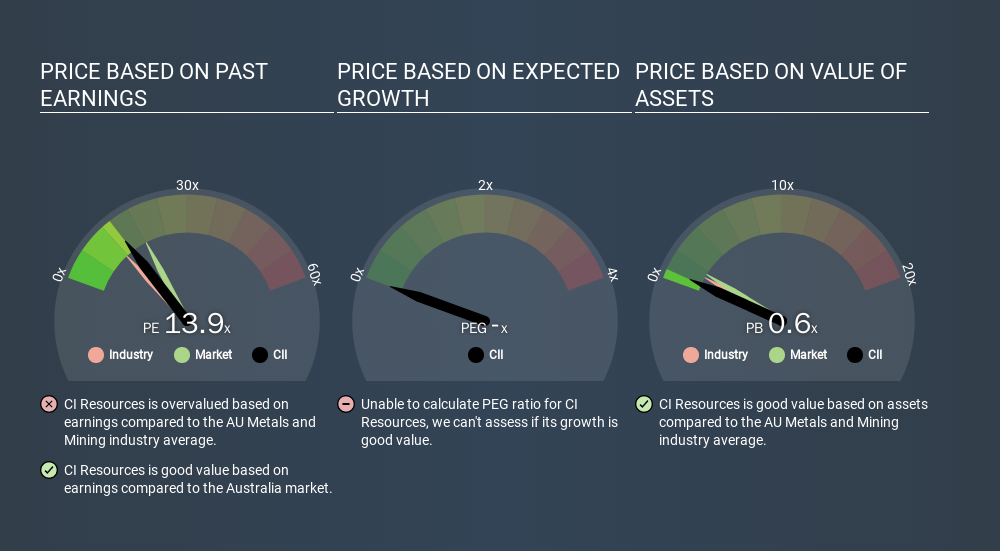
The goal of this article is to teach you how to use price to earnings ratios (P/E ratios). We'll look at CI Resources Limited's (ASX:CII) P/E ratio and reflect on what it tells us about the company's share price. CI Resources has a price to earnings ratio of 13.86, based on the last twelve months. In other words, at today's prices, investors are paying A$13.86 for every A$1 in prior year profit.
Check out our latest analysis for CI Resources
How Do I Calculate A Price To Earnings Ratio?
The formula for P/E is:
Price to Earnings Ratio = Price per Share ÷ Earnings per Share (EPS)
Or for CI Resources:
P/E of 13.86 = AUD1.04 ÷ AUD0.08 (Based on the trailing twelve months to June 2019.)
Is A High P/E Ratio Good?
The higher the P/E ratio, the higher the price tag of a business, relative to its trailing earnings. That isn't necessarily good or bad, but a high P/E implies relatively high expectations of what a company can achieve in the future.
Does CI Resources Have A Relatively High Or Low P/E For Its Industry?
We can get an indication of market expectations by looking at the P/E ratio. As you can see below, CI Resources has a higher P/E than the average company (11.6) in the metals and mining industry.
That means that the market expects CI Resources will outperform other companies in its industry. Shareholders are clearly optimistic, but the future is always uncertain. So investors should always consider the P/E ratio alongside other factors, such as whether company directors have been buying shares.
How Growth Rates Impact P/E Ratios
If earnings fall then in the future the 'E' will be lower. Therefore, even if you pay a low multiple of earnings now, that multiple will become higher in the future. Then, a higher P/E might scare off shareholders, pushing the share price down.
CI Resources saw earnings per share decrease by 59% last year. And it has shrunk its earnings per share by 13% per year over the last five years. This could justify a pessimistic P/E.
A Limitation: P/E Ratios Ignore Debt and Cash In The Bank
It's important to note that the P/E ratio considers the market capitalization, not the enterprise value. Thus, the metric does not reflect cash or debt held by the company. Hypothetically, a company could reduce its future P/E ratio by spending its cash (or taking on debt) to achieve higher earnings.
While growth expenditure doesn't always pay off, the point is that it is a good option to have; but one that the P/E ratio ignores.
So What Does CI Resources's Balance Sheet Tell Us?
With net cash of AU$34m, CI Resources has a very strong balance sheet, which may be important for its business. Having said that, at 28% of its market capitalization the cash hoard would contribute towards a higher P/E ratio.
The Bottom Line On CI Resources's P/E Ratio
CI Resources's P/E is 13.9 which is below average (18.2) in the AU market. The recent drop in earnings per share would make investors cautious, but the net cash position means the company has time to improve: if so, the low P/E could be an opportunity.
Investors have an opportunity when market expectations about a stock are wrong. If it is underestimating a company, investors can make money by buying and holding the shares until the market corrects itself. We don't have analyst forecasts, but you could get a better understanding of its growth by checking out this more detailed historical graph of earnings, revenue and cash flow.
But note: CI Resources may not be the best stock to buy. So take a peek at this free list of interesting companies with strong recent earnings growth (and a P/E ratio below 20).
If you spot an error that warrants correction, please contact the editor at editorial-team@simplywallst.com. This article by Simply Wall St is general in nature. It does not constitute a recommendation to buy or sell any stock, and does not take account of your objectives, or your financial situation. Simply Wall St has no position in the stocks mentioned.
We aim to bring you long-term focused research analysis driven by fundamental data. Note that our analysis may not factor in the latest price-sensitive company announcements or qualitative material. Thank you for reading.
About ASX:PRG
PRL Global
Engages in the mining, processing, and sale of phosphate rock, phosphate dust, and chalk in Africa, Asia, Europe, Australia, North America, and Oceania.
Mediocre balance sheet with questionable track record.
Market Insights


Advertisement
Community Narratives
The Future of Drug Testing? Fingerprint Tech Shows Serious Promise
Fair Value US$2.98|40.3% undervalued
JO
Community Contributor
Suncorp’s Next Chapter: Insurance-Only and Ready to Grow
Fair Value AU$22.83|8.8% undervalued
RO
Community Contributor
Thyssenkrupp Nucera Will Achieve Double-Digit Profits by 2030 Boosted by Hydrogen Growth
Fair Value €14.40|31.3% undervalued
CH
Community Contributor
Tesla’s Nvidia Moment – The AI & Robotics Inflection Point
Fair Value US$384.84|18.1% undervalued
BL
Community Contributor