- India
- /
- Paper and Forestry Products
- /
- NSEI:CENTURYPLY
Should You Be Tempted To Sell Century Plyboards (India) Limited (NSE:CENTURYPLY) Because Of Its P/E Ratio?


Today, we'll introduce the concept of the P/E ratio for those who are learning about investing. To keep it practical, we'll show how Century Plyboards (India) Limited's (NSE:CENTURYPLY) P/E ratio could help you assess the value on offer. What is Century Plyboards (India)'s P/E ratio? Well, based on the last twelve months it is 19.13. That corresponds to an earnings yield of approximately 5.2%.
See our latest analysis for Century Plyboards (India)
How Do I Calculate Century Plyboards (India)'s Price To Earnings Ratio?
The formula for price to earnings is:
Price to Earnings Ratio = Share Price ÷ Earnings per Share (EPS)
Or for Century Plyboards (India):
P/E of 19.13 = ₹120.350 ÷ ₹6.290 (Based on the year to December 2019.)
(Note: the above calculation results may not be precise due to rounding.)
Is A High Price-to-Earnings Ratio Good?
A higher P/E ratio means that buyers have to pay a higher price for each ₹1 the company has earned over the last year. That isn't a good or a bad thing on its own, but a high P/E means that buyers have a higher opinion of the business's prospects, relative to stocks with a lower P/E.
How Does Century Plyboards (India)'s P/E Ratio Compare To Its Peers?
The P/E ratio indicates whether the market has higher or lower expectations of a company. You can see in the image below that the average P/E (7.4) for companies in the forestry industry is lower than Century Plyboards (India)'s P/E.
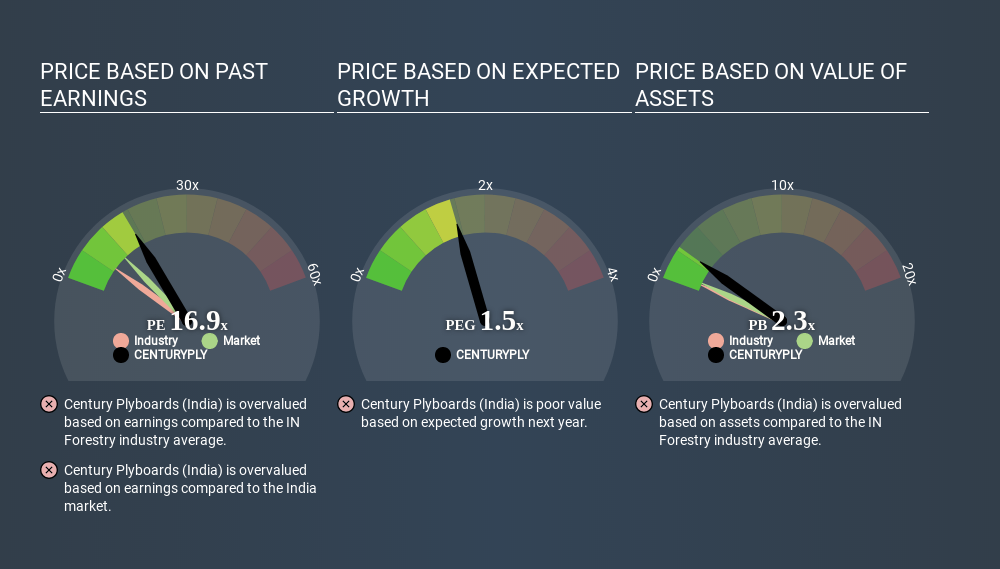
Century Plyboards (India)'s P/E tells us that market participants think the company will perform better than its industry peers, going forward. Clearly the market expects growth, but it isn't guaranteed. So further research is always essential. I often monitor director buying and selling.
How Growth Rates Impact P/E Ratios
Companies that shrink earnings per share quickly will rapidly decrease the 'E' in the equation. That means unless the share price falls, the P/E will increase in a few years. Then, a higher P/E might scare off shareholders, pushing the share price down.
Century Plyboards (India) shrunk earnings per share by 8.1% last year. And it has shrunk its earnings per share by 1.3% per year over the last five years. So we might expect a relatively low P/E.
A Limitation: P/E Ratios Ignore Debt and Cash In The Bank
It's important to note that the P/E ratio considers the market capitalization, not the enterprise value. So it won't reflect the advantage of cash, or disadvantage of debt. In theory, a company can lower its future P/E ratio by using cash or debt to invest in growth.
Such spending might be good or bad, overall, but the key point here is that you need to look at debt to understand the P/E ratio in context.
Is Debt Impacting Century Plyboards (India)'s P/E?
Century Plyboards (India) has net debt worth 13% of its market capitalization. It would probably deserve a higher P/E ratio if it was net cash, since it would have more options for growth.
The Bottom Line On Century Plyboards (India)'s P/E Ratio
Century Plyboards (India)'s P/E is 19.1 which is above average (11.3) in its market. With some debt but no EPS growth last year, the market has high expectations of future profits.
When the market is wrong about a stock, it gives savvy investors an opportunity. If the reality for a company is better than it expects, you can make money by buying and holding for the long term. So this free visual report on analyst forecasts could hold the key to an excellent investment decision.
Of course, you might find a fantastic investment by looking at a few good candidates. So take a peek at this free list of companies with modest (or no) debt, trading on a P/E below 20.
Love or hate this article? Concerned about the content? Get in touch with us directly. Alternatively, email editorial-team@simplywallst.com.
This article by Simply Wall St is general in nature. It does not constitute a recommendation to buy or sell any stock, and does not take account of your objectives, or your financial situation. We aim to bring you long-term focused analysis driven by fundamental data. Note that our analysis may not factor in the latest price-sensitive company announcements or qualitative material. Simply Wall St has no position in any stocks mentioned. Thank you for reading.
About NSEI:CENTURYPLY
Century Plyboards (India)
Manufactures and sells plywood, laminates, decorative veneers, medium density fiber boards (MDF), pre-laminated boards, particle boards, and flush doors in India.
Reasonable growth potential with mediocre balance sheet.
Similar Companies
Market Insights

Community Narratives

