
Advertisement
- New Zealand
- /
- Telecom Services and Carriers
- /
- NZSE:SPK
Should You Be Impressed By Spark New Zealand Limited's (NZSE:SPK) ROE?

Many investors are still learning about the various metrics that can be useful when analysing a stock. This article is for those who would like to learn about Return On Equity (ROE). By way of learning-by-doing, we'll look at ROE to gain a better understanding of Spark New Zealand Limited (NZSE:SPK).
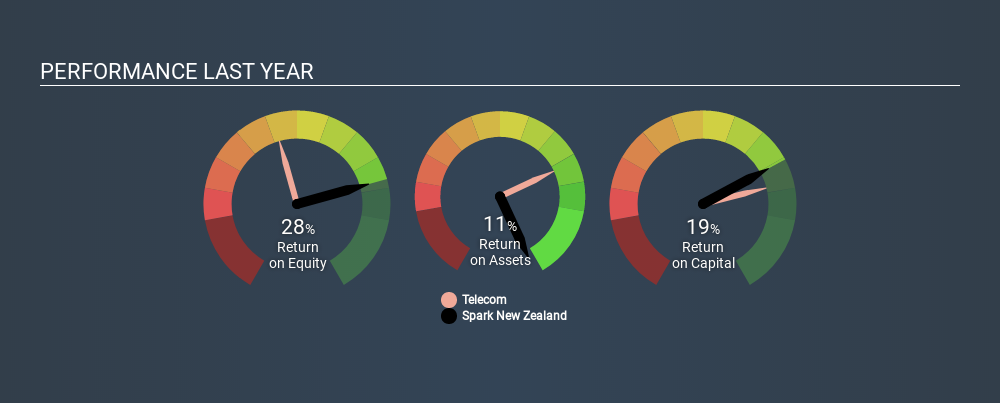
Our data shows Spark New Zealand has a return on equity of 28% for the last year. Another way to think of that is that for every NZ$1 worth of equity in the company, it was able to earn NZ$0.28.
Check out our latest analysis for Spark New Zealand
How Do You Calculate Return On Equity?
The formula for return on equity is:
Return on Equity = Net Profit (from continuing operations) ÷ Shareholders' Equity
Or for Spark New Zealand:
28% = NZ$409m ÷ NZ$1.5b (Based on the trailing twelve months to June 2019.)
Most know that net profit is the total earnings after all expenses, but the concept of shareholders' equity is a little more complicated. It is the capital paid in by shareholders, plus any retained earnings. You can calculate shareholders' equity by subtracting the company's total liabilities from its total assets.
What Does ROE Mean?
ROE looks at the amount a company earns relative to the money it has kept within the business. The 'return' is the profit over the last twelve months. That means that the higher the ROE, the more profitable the company is. So, as a general rule, a high ROE is a good thing. That means it can be interesting to compare the ROE of different companies.
Does Spark New Zealand Have A Good Return On Equity?
Arguably the easiest way to assess company's ROE is to compare it with the average in its industry. However, this method is only useful as a rough check, because companies do differ quite a bit within the same industry classification. As is clear from the image below, Spark New Zealand has a better ROE than the average (13%) in the Telecom industry.
That's what I like to see. We think a high ROE, alone, is usually enough to justify further research into a company. One data point to check is if insiders have bought shares recently.
How Does Debt Impact Return On Equity?
Virtually all companies need money to invest in the business, to grow profits. That cash can come from issuing shares, retained earnings, or debt. In the first and second cases, the ROE will reflect this use of cash for investment in the business. In the latter case, the debt required for growth will boost returns, but will not impact the shareholders' equity. That will make the ROE look better than if no debt was used.
Combining Spark New Zealand's Debt And Its 28% Return On Equity
Spark New Zealand clearly uses a significant amount of debt to boost returns, as it has a debt to equity ratio of 1.03. I think the ROE is impressive, but it would have been assisted by the use of debt. Debt increases risk and reduces options for the company in the future, so you generally want to see some good returns from using it.
The Key Takeaway
Return on equity is useful for comparing the quality of different businesses. In my book the highest quality companies have high return on equity, despite low debt. If two companies have around the same level of debt to equity, and one has a higher ROE, I'd generally prefer the one with higher ROE.
But ROE is just one piece of a bigger puzzle, since high quality businesses often trade on high multiples of earnings. Profit growth rates, versus the expectations reflected in the price of the stock, are a particularly important to consider. So I think it may be worth checking this free report on analyst forecasts for the company.
Of course Spark New Zealand may not be the best stock to buy. So you may wish to see this free collection of other companies that have high ROE and low debt.
If you spot an error that warrants correction, please contact the editor at editorial-team@simplywallst.com. This article by Simply Wall St is general in nature. It does not constitute a recommendation to buy or sell any stock, and does not take account of your objectives, or your financial situation. Simply Wall St has no position in the stocks mentioned.
We aim to bring you long-term focused research analysis driven by fundamental data. Note that our analysis may not factor in the latest price-sensitive company announcements or qualitative material. Thank you for reading.
About NZSE:SPK
Spark New Zealand
Provides telecommunications and digital services in New Zealand.
Average dividend payer and fair value.
Similar Companies
Market Insights


Advertisement
Community Narratives
The Future of Drug Testing? Fingerprint Tech Shows Serious Promise
Fair Value US$2.98|38.6% undervalued
JO
Community Contributor
Suncorp’s Next Chapter: Insurance-Only and Ready to Grow
Fair Value AU$22.83|8.8% undervalued
RO
Community Contributor
Thyssenkrupp Nucera Will Achieve Double-Digit Profits by 2030 Boosted by Hydrogen Growth
Fair Value €14.40|31.3% undervalued
CH
Community Contributor
Tesla’s Nvidia Moment – The AI & Robotics Inflection Point
Fair Value US$384.84|18.0% undervalued
BL
Community Contributor