
Advertisement
Should You Be Excited About Bata India Limited's (NSE:BATAINDIA) 21% Return On Equity?

While some investors are already well versed in financial metrics (hat tip), this article is for those who would like to learn about Return On Equity (ROE) and why it is important. To keep the lesson grounded in practicality, we'll use ROE to better understand Bata India Limited (NSE:BATAINDIA).
Over the last twelve months Bata India has recorded a ROE of 21%. One way to conceptualize this, is that for each ₹1 of shareholders' equity it has, the company made ₹0.21 in profit.
See our latest analysis for Bata India
How Do You Calculate Return On Equity?
The formula for ROE is:
Return on Equity = Net Profit (from continuing operations) ÷ Shareholders' Equity
Or for Bata India:
21% = ₹3.6b ÷ ₹17b (Based on the trailing twelve months to September 2019.)
It's easy to understand the 'net profit' part of that equation, but 'shareholders' equity' requires further explanation. It is the capital paid in by shareholders, plus any retained earnings. Shareholders' equity can be calculated by subtracting the total liabilities of the company from the total assets of the company.
What Does Return On Equity Signify?
ROE measures a company's profitability against the profit it retains, and any outside investments. The 'return' is the yearly profit. A higher profit will lead to a higher ROE. So, all else being equal, a high ROE is better than a low one. That means ROE can be used to compare two businesses.
Does Bata India Have A Good ROE?
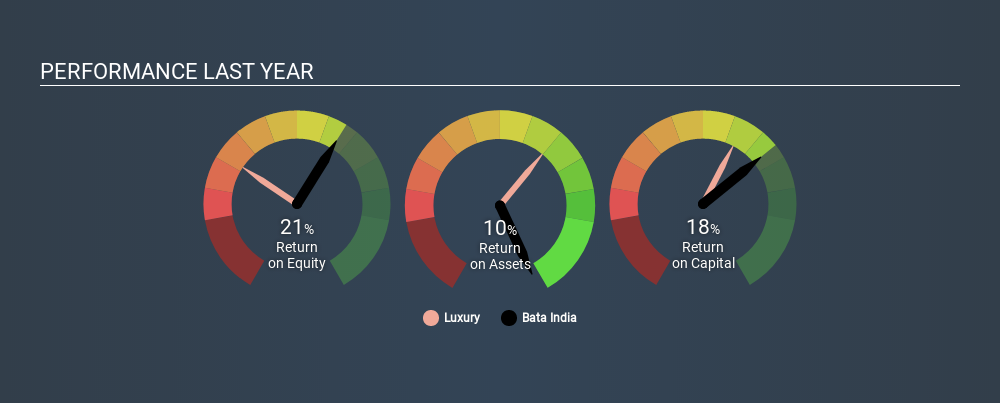
Arguably the easiest way to assess company's ROE is to compare it with the average in its industry. However, this method is only useful as a rough check, because companies do differ quite a bit within the same industry classification. As you can see in the graphic below, Bata India has a higher ROE than the average (7.1%) in the Luxury industry.
That's what I like to see. I usually take a closer look when a company has a better ROE than industry peers. One data point to check is if insiders have bought shares recently.
Why You Should Consider Debt When Looking At ROE
Most companies need money -- from somewhere -- to grow their profits. That cash can come from issuing shares, retained earnings, or debt. In the first two cases, the ROE will capture this use of capital to grow. In the latter case, the use of debt will improve the returns, but will not change the equity. Thus the use of debt can improve ROE, albeit along with extra risk in the case of stormy weather, metaphorically speaking.
Combining Bata India's Debt And Its 21% Return On Equity
One positive for shareholders is that Bata India does not have any net debt! Its solid ROE indicates a good business, especially when you consider it is not using leverage. After all, when a company has a strong balance sheet, it can often find ways to invest in growth, even if it takes some time.
But It's Just One Metric
Return on equity is one way we can compare the business quality of different companies. A company that can achieve a high return on equity without debt could be considered a high quality business. If two companies have around the same level of debt to equity, and one has a higher ROE, I'd generally prefer the one with higher ROE.
But ROE is just one piece of a bigger puzzle, since high quality businesses often trade on high multiples of earnings. Profit growth rates, versus the expectations reflected in the price of the stock, are a particularly important to consider. So you might want to take a peek at this data-rich interactive graph of forecasts for the company.
If you would prefer check out another company -- one with potentially superior financials -- then do not miss thisfree list of interesting companies, that have HIGH return on equity and low debt.
If you spot an error that warrants correction, please contact the editor at editorial-team@simplywallst.com. This article by Simply Wall St is general in nature. It does not constitute a recommendation to buy or sell any stock, and does not take account of your objectives, or your financial situation. Simply Wall St has no position in the stocks mentioned.
We aim to bring you long-term focused research analysis driven by fundamental data. Note that our analysis may not factor in the latest price-sensitive company announcements or qualitative material. Thank you for reading.
About NSEI:BATAINDIA
Bata India
Manufactures and trades in footwear and accessories through its retail and wholesale network in India and internationally.
Flawless balance sheet established dividend payer.
Similar Companies
Market Insights


Advertisement
Community Narratives
For the Emperor: Why Games Workshop Could Be a Star Investment
Fair Value UK£160.00|0.1% overvalued
RO
Community Contributor
Securitas will boost margins with AI and tech-driven services
Fair Value SEK 260.91|44.5% undervalued
UN
Community Contributor
A Leader in EV Charging with Growth Potential
Fair Value €27.00|20.9% undervalued
TI
Community Contributor