
Advertisement
- Canada
- /
- Real Estate
- /
- TSX:MRD
Reflecting on Melcor Developments' (TSE:MRD) Share Price Returns Over The Last Five Years

The main aim of stock picking is to find the market-beating stocks. But the main game is to find enough winners to more than offset the losers At this point some shareholders may be questioning their investment in Melcor Developments Ltd. (TSE:MRD), since the last five years saw the share price fall 56%. And some of the more recent buyers are probably worried, too, with the stock falling 42% in the last year. More recently, the share price has dropped a further 8.3% in a month. We do note, however, that the broader market is down 3.5% in that period, and this may have weighed on the share price.
Check out our latest analysis for Melcor Developments
While markets are a powerful pricing mechanism, share prices reflect investor sentiment, not just underlying business performance. One flawed but reasonable way to assess how sentiment around a company has changed is to compare the earnings per share (EPS) with the share price.
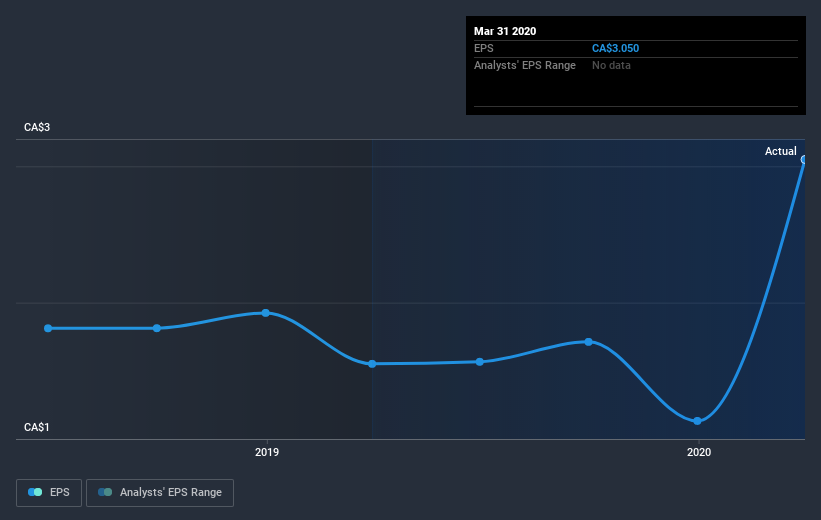
Looking back five years, both Melcor Developments's share price and EPS declined; the latter at a rate of 2.0% per year. Readers should note that the share price has fallen faster than the EPS, at a rate of 15% per year, over the period. This implies that the market is more cautious about the business these days. The low P/E ratio of 2.54 further reflects this reticence.
You can see below how EPS has changed over time (discover the exact values by clicking on the image).
It is of course excellent to see how Melcor Developments has grown profits over the years, but the future is more important for shareholders. This free interactive report on Melcor Developments's balance sheet strength is a great place to start, if you want to investigate the stock further.
What About Dividends?
It is important to consider the total shareholder return, as well as the share price return, for any given stock. Whereas the share price return only reflects the change in the share price, the TSR includes the value of dividends (assuming they were reinvested) and the benefit of any discounted capital raising or spin-off. Arguably, the TSR gives a more comprehensive picture of the return generated by a stock. In the case of Melcor Developments, it has a TSR of -46% for the last 5 years. That exceeds its share price return that we previously mentioned. The dividends paid by the company have thusly boosted the total shareholder return.
A Different Perspective
We regret to report that Melcor Developments shareholders are down 39% for the year (even including dividends) . Unfortunately, that's worse than the broader market decline of 9.3%. Having said that, it's inevitable that some stocks will be oversold in a falling market. The key is to keep your eyes on the fundamental developments. Regrettably, last year's performance caps off a bad run, with the shareholders facing a total loss of 12% per year over five years. Generally speaking long term share price weakness can be a bad sign, though contrarian investors might want to research the stock in hope of a turnaround. It's always interesting to track share price performance over the longer term. But to understand Melcor Developments better, we need to consider many other factors. For instance, we've identified 3 warning signs for Melcor Developments (2 are significant) that you should be aware of.
For those who like to find winning investments this free list of growing companies with recent insider purchasing, could be just the ticket.
Please note, the market returns quoted in this article reflect the market weighted average returns of stocks that currently trade on CA exchanges.
If you decide to trade Melcor Developments, use the lowest-cost* platform that is rated #1 Overall by Barron’s, Interactive Brokers. Trade stocks, options, futures, forex, bonds and funds on 135 markets, all from a single integrated account.Promoted
New: Manage All Your Stock Portfolios in One Place
We've created the ultimate portfolio companion for stock investors, and it's free.
• Connect an unlimited number of Portfolios and see your total in one currency
• Be alerted to new Warning Signs or Risks via email or mobile
• Track the Fair Value of your stocks
This article by Simply Wall St is general in nature. It does not constitute a recommendation to buy or sell any stock, and does not take account of your objectives, or your financial situation. We aim to bring you long-term focused analysis driven by fundamental data. Note that our analysis may not factor in the latest price-sensitive company announcements or qualitative material. Simply Wall St has no position in any stocks mentioned.
*Interactive Brokers Rated Lowest Cost Broker by StockBrokers.com Annual Online Review 2020
Have feedback on this article? Concerned about the content? Get in touch with us directly. Alternatively, email editorial-team@simplywallst.com.
About TSX:MRD
Melcor Developments
Operates as a real estate development company in the United States and Canada.
Adequate balance sheet slight.
Market Insights

Advertisement
Community Narratives
Groundbreaking therapies that could change the treatment landscape for PTSD, fibromyalgia, MS & Alzheimer’s
Fair Value US$6.20|82.7% undervalued
CM
Community Contributor
DigitalOcean Will Grow 14% by Embracing AI with Paperspace Acquisition
Fair Value US$50.00|36.8% undervalued
NE
Community Contributor
Viant Technology: A Rising AdTech Challenger in the AI-Powered CTV Market
Fair Value US$38.61|61.4% undervalued
BL
Community Contributor
Volvo will Accelerate Forward into Electric and Autonomous Leadership in Five Years
Fair Value SEK 438.80|37.1% undervalued
UN
Community Contributor