
Advertisement
- United States
- /
- Electric Utilities
- /
- NYSE:NRG
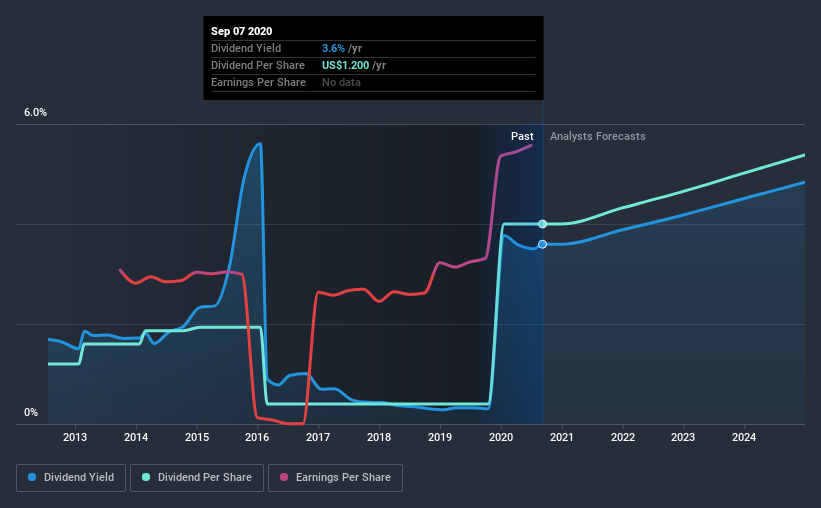
NRG Energy, Inc.'s (NYSE:NRG) 3.6% Dividend Yield Looks Pretty Interesting

Dividend paying stocks like NRG Energy, Inc. (NYSE:NRG) tend to be popular with investors, and for good reason - some research suggests a significant amount of all stock market returns come from reinvested dividends. If you are hoping to live on the income from dividends, it's important to be a lot more stringent with your investments than the average punter.
With a goodly-sized dividend yield despite a relatively short payment history, investors might be wondering if NRG Energy is a new dividend aristocrat in the making. We'd agree the yield does look enticing. During the year, the company also conducted a buyback equivalent to around 7.3% of its market capitalisation. Some simple research can reduce the risk of buying NRG Energy for its dividend - read on to learn more.
Click the interactive chart for our full dividend analysis
Payout ratios
Companies (usually) pay dividends out of their earnings. If a company is paying more than it earns, the dividend might have to be cut. As a result, we should always investigate whether a company can afford its dividend, measured as a percentage of a company's net income after tax. NRG Energy paid out 5.4% of its profit as dividends, over the trailing twelve month period. We like this low payout ratio, because it implies the dividend is well covered and leaves ample opportunity for reinvestment.
Another important check we do is to see if the free cash flow generated is sufficient to pay the dividend. NRG Energy's cash payout ratio last year was 11%, which is quite low and suggests that the dividend was thoroughly covered by cash flow. It's positive to see that NRG Energy's dividend is covered by both profits and cash flow, since this is generally a sign that the dividend is sustainable, and a lower payout ratio usually suggests a greater margin of safety before the dividend gets cut.
Is NRG Energy's Balance Sheet Risky?
As NRG Energy has a meaningful amount of debt, we need to check its balance sheet to see if the company might have debt risks. A quick check of its financial situation can be done with two ratios: net debt divided by EBITDA (earnings before interest, tax, depreciation and amortisation), and net interest cover. Net debt to EBITDA is a measure of a company's total debt. Net interest cover measures the ability to meet interest payments. Essentially we check that a) the company does not have too much debt, and b) that it can afford to pay the interest. With net debt of 2.61 times its EBITDA, NRG Energy's debt burden is within a normal range for most listed companies.
Net interest cover can be calculated by dividing earnings before interest and tax (EBIT) by the company's net interest expense. Interest cover of 3.83 times its interest expense is starting to become a concern for NRG Energy, and be aware that lenders may place additional restrictions on the company as well.
Remember, you can always get a snapshot of NRG Energy's latest financial position, by checking our visualisation of its financial health.
Dividend Volatility
Before buying a stock for its income, we want to see if the dividends have been stable in the past, and if the company has a track record of maintaining its dividend. Looking at the last decade of data, we can see that NRG Energy paid its first dividend at least eight years ago. Its dividend has not fluctuated much that time, which we like, but we're conscious that the company might not yet have a track record of maintaining dividends in all economic conditions. During the past eight-year period, the first annual payment was US$0.4 in 2012, compared to US$1.2 last year. This works out to be a compound annual growth rate (CAGR) of approximately 16% a year over that time.
The dividend has been growing pretty quickly, which could be enough to get us interested even though the dividend history is relatively short. Further research may be warranted.
Dividend Growth Potential
While dividend payments have been relatively reliable, it would also be nice if earnings per share (EPS) were growing, as this is essential to maintaining the dividend's purchasing power over the long term. It's good to see NRG Energy has been growing its earnings per share at 136% a year over the past five years. The company is only paying out a fraction of its earnings as dividends, and in the past been able to use the retained earnings to grow its profits rapidly - an ideal combination.
Conclusion
To summarise, shareholders should always check that NRG Energy's dividends are affordable, that its dividend payments are relatively stable, and that it has decent prospects for growing its earnings and dividend. Firstly, we like that NRG Energy has low and conservative payout ratios. Next, earnings growth has been good, but unfortunately the company has not been paying dividends as long as we'd like. NRG Energy performs highly under this analysis, although it falls slightly short of our exacting standards. At the right valuation, it could be a solid dividend prospect.
It's important to note that companies having a consistent dividend policy will generate greater investor confidence than those having an erratic one. At the same time, there are other factors our readers should be conscious of before pouring capital into a stock. Just as an example, we've come accross 4 warning signs for NRG Energy you should be aware of, and 2 of them don't sit too well with us.
If you are a dividend investor, you might also want to look at our curated list of dividend stocks yielding above 3%.
When trading NRG Energy or any other investment, use the platform considered by many to be the Professional's Gateway to the Worlds Market, Interactive Brokers. You get the lowest-cost* trading on stocks, options, futures, forex, bonds and funds worldwide from a single integrated account. Promoted
Valuation is complex, but we're here to simplify it.
Discover if NRG Energy might be undervalued or overvalued with our detailed analysis, featuring fair value estimates, potential risks, dividends, insider trades, and its financial condition.
Access Free AnalysisThis article by Simply Wall St is general in nature. It does not constitute a recommendation to buy or sell any stock, and does not take account of your objectives, or your financial situation. We aim to bring you long-term focused analysis driven by fundamental data. Note that our analysis may not factor in the latest price-sensitive company announcements or qualitative material. Simply Wall St has no position in any stocks mentioned.
*Interactive Brokers Rated Lowest Cost Broker by StockBrokers.com Annual Online Review 2020
Have feedback on this article? Concerned about the content? Get in touch with us directly. Alternatively, email editorial-team@simplywallst.com.
About NYSE:NRG
NRG Energy
Operates as an energy and home services company in the United States and Canada.
Adequate balance sheet average dividend payer.
Similar Companies
Market Insights


Advertisement
Community Narratives
The Future of Drug Testing? Fingerprint Tech Shows Serious Promise
Fair Value US$2.98|40.3% undervalued
JO
Community Contributor
Suncorp’s Next Chapter: Insurance-Only and Ready to Grow
Fair Value AU$22.83|7.6% undervalued
RO
Community Contributor
Thyssenkrupp Nucera Will Achieve Double-Digit Profits by 2030 Boosted by Hydrogen Growth
Fair Value €14.40|31.6% undervalued
CH
Community Contributor
Tesla’s Nvidia Moment – The AI & Robotics Inflection Point
Fair Value US$359.72|12.3% undervalued
BL
Community Contributor