Advertisement
November 2025's Stocks That May Be Trading Below Estimated Value

Simply Wall St
Reviewed by Simply Wall St
As of the end of October 2025, U.S. stock markets have shown resilience, with major indices like the Nasdaq, S&P 500, and Dow Jones Industrial Average posting solid gains for both the week and month. In this environment of growth and recovery, identifying stocks that may be trading below their estimated value can present opportunities for investors seeking to capitalize on potential market inefficiencies.
Top 10 Undervalued Stocks Based On Cash Flows In The United States
| Name | Current Price | Fair Value (Est) | Discount (Est) |
| TowneBank (TOWN) | $32.51 | $64.47 | 49.6% |
| Similarweb (SMWB) | $8.55 | $16.92 | 49.5% |
| Owens Corning (OC) | $127.31 | $254.03 | 49.9% |
| Old National Bancorp (ONB) | $20.43 | $40.82 | 49.9% |
| NeuroPace (NPCE) | $9.94 | $19.59 | 49.3% |
| Huntington Bancshares (HBAN) | $15.44 | $30.88 | 50% |
| Eagle Bancorp (EGBN) | $16.75 | $33.24 | 49.6% |
| DexCom (DXCM) | $58.22 | $113.90 | 48.9% |
| Compass (COMP) | $7.71 | $15.15 | 49.1% |
| Ategrity Specialty Insurance Company Holdings (ASIC) | $19.43 | $38.00 | 48.9% |
We'll examine a selection from our screener results.
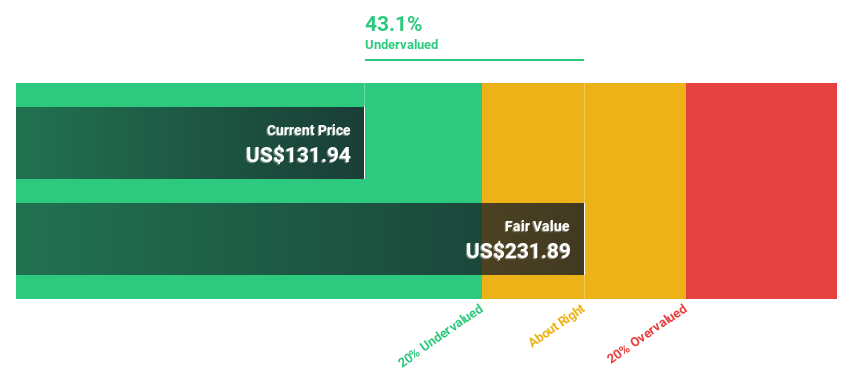
Jabil (JBL)
Overview: Jabil Inc. offers engineering, manufacturing, and supply chain solutions globally with a market cap of approximately $23.60 billion.
Operations: The company's revenue segments include Regulated Industries at $11.88 billion, Intelligent Infrastructure at $12.32 billion, and Connected Living and Digital Commerce at $5.61 billion.
Estimated Discount To Fair Value: 14.6%
Jabil is trading at US$220.89, below its estimated fair value of US$258.58, indicating potential undervaluation based on cash flows. The company's earnings are forecast to grow significantly at 20.3% annually, outpacing the broader U.S. market's growth rate of 16.1%. However, Jabil carries a high level of debt and has seen a decline in profit margins from 4.8% to 2.2% over the past year, which may warrant caution for investors seeking undervalued opportunities based on cash flows.
- Our expertly prepared growth report on Jabil implies its future financial outlook may be stronger than recent results.
- Click to explore a detailed breakdown of our findings in Jabil's balance sheet health report.
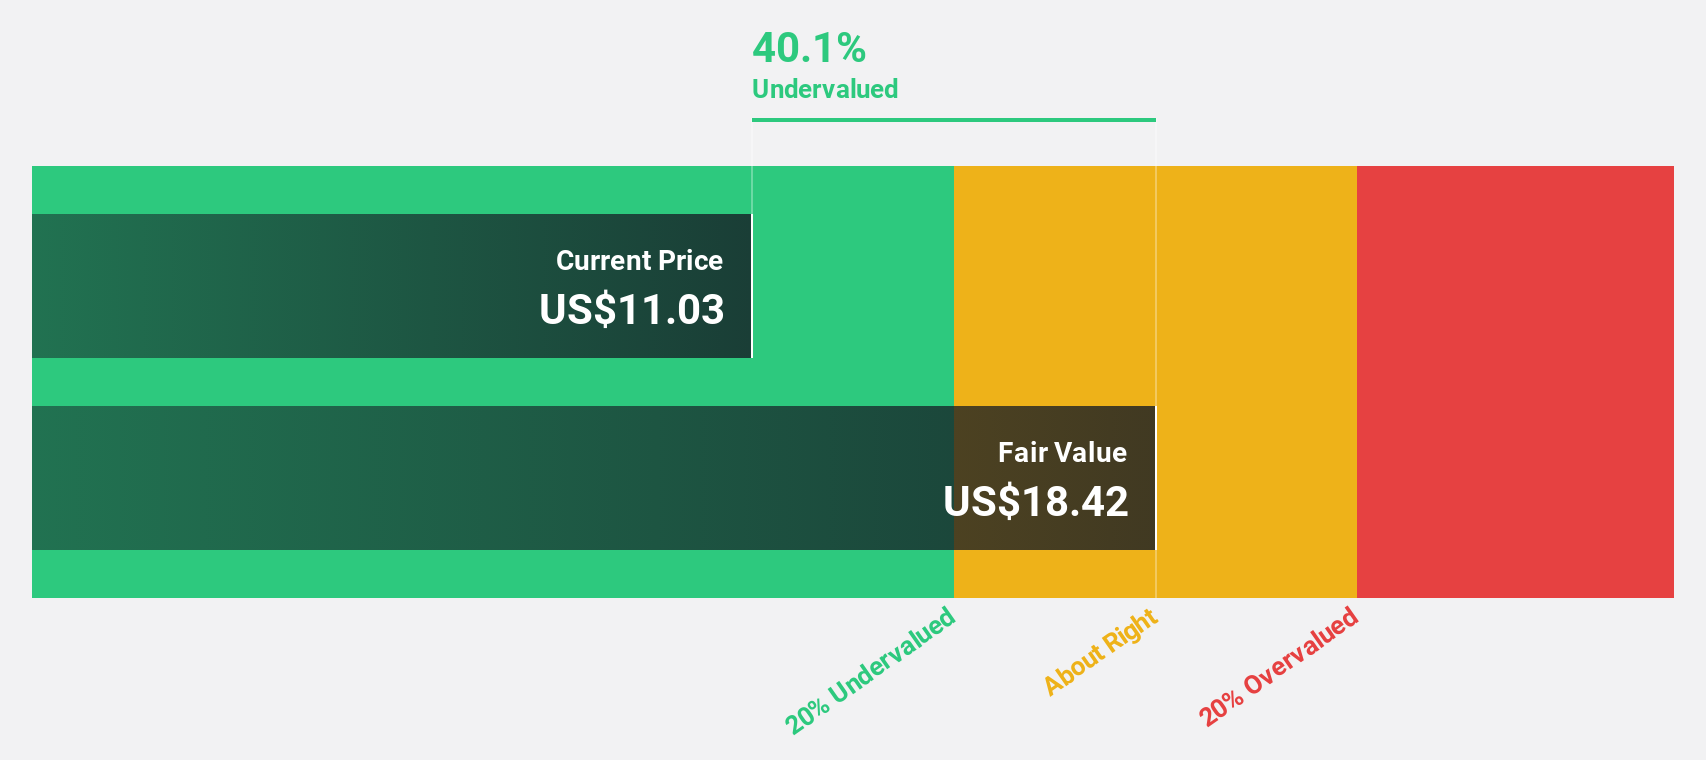
Rithm Capital (RITM)
Overview: Rithm Capital Corp. is a U.S.-based asset manager specializing in real estate, credit, and financial services, with a market cap of approximately $6.08 billion.
Operations: Rithm Capital's revenue segments include Asset Management at $503.94 million and Origination and Servicing at $898.03 million, while other segments reported negative figures.
Estimated Discount To Fair Value: 40.6%
Rithm Capital, trading at US$10.97, is significantly below its estimated fair value of US$18.48, suggesting it may be undervalued based on cash flows. The company's earnings are projected to grow 23% annually, surpassing the U.S. market's growth rate of 16.1%. However, its dividend yield of 9.12% isn't well-supported by free cash flows and debt coverage by operating cash flow remains inadequate, presenting potential risks for investors focused on undervaluation through cash flow analysis.
- Upon reviewing our latest growth report, Rithm Capital's projected financial performance appears quite optimistic.
- Click here and access our complete balance sheet health report to understand the dynamics of Rithm Capital.
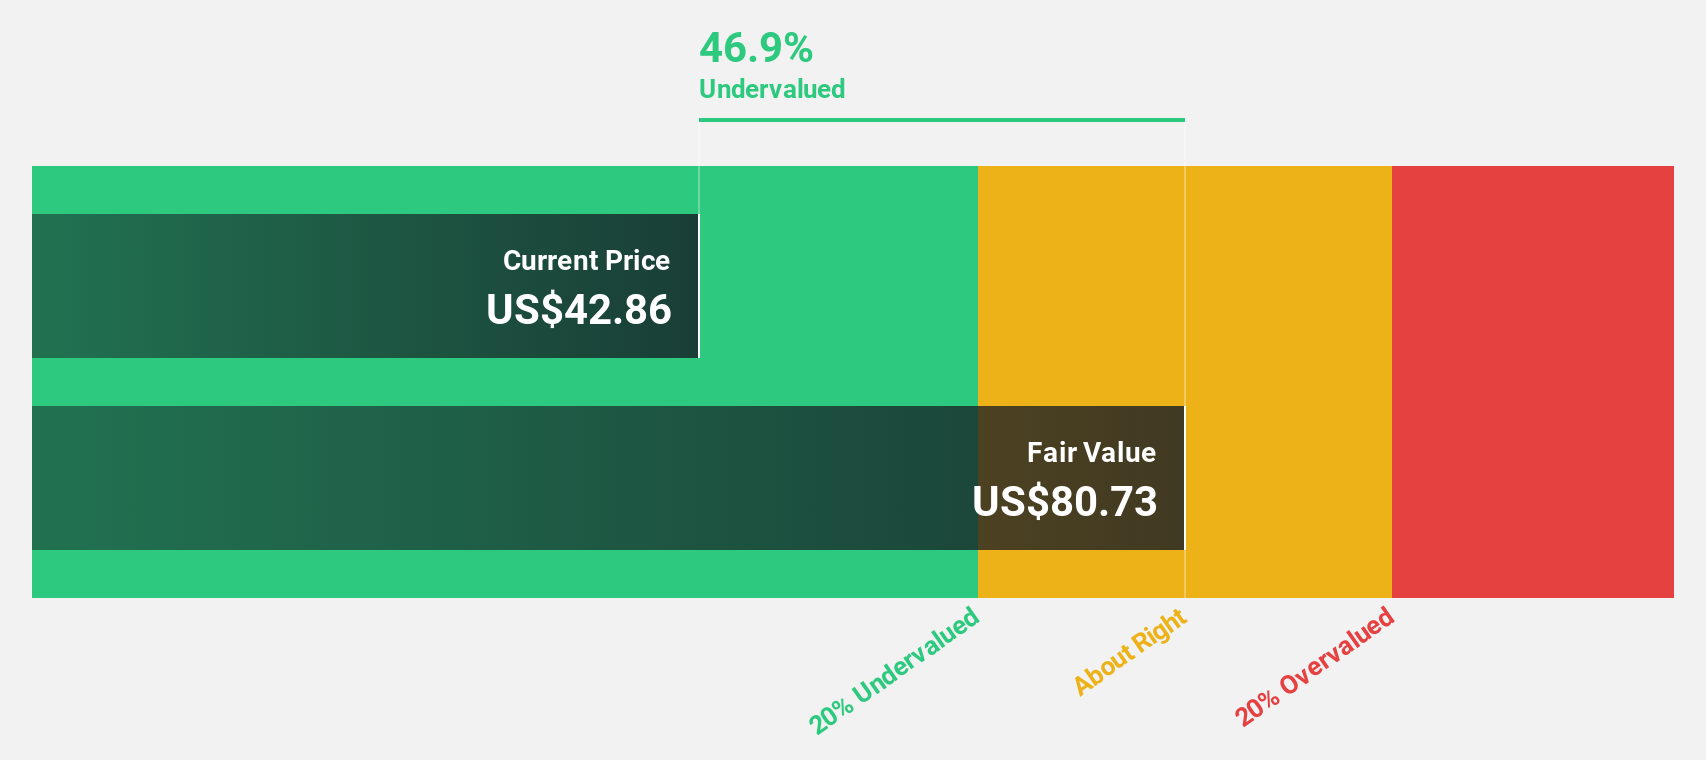
Cactus (WHD)
Overview: Cactus, Inc. designs, manufactures, sells, and rents engineered pressure control and spoolable pipe technologies across various global markets, with a market cap of approximately $3.53 billion.
Operations: The company's revenue is primarily derived from its Pressure Control segment, which generated $715.48 million, and its Spoolable Technologies segment, contributing $380.12 million.
Estimated Discount To Fair Value: 38%
Cactus, Inc., with a current trading price of US$44.17, is significantly undervalued compared to its estimated fair value of US$71.19, highlighting potential attractiveness in cash flow valuation. Despite recent earnings declines—US$41.62 million net income for Q3 2025 compared to US$49.93 million last year—the company maintains a positive outlook with projected annual earnings growth of 28.9%. However, significant insider selling may concern cautious investors evaluating long-term prospects based on cash flows.
- In light of our recent growth report, it seems possible that Cactus' financial performance will exceed current levels.
- Take a closer look at Cactus' balance sheet health here in our report.
Key Takeaways
- Embark on your investment journey to our 170 Undervalued US Stocks Based On Cash Flows selection here.
- Have you diversified into these companies? Leverage the power of Simply Wall St's portfolio to keep a close eye on market movements affecting your investments.
- Simply Wall St is your key to unlocking global market trends, a free user-friendly app for forward-thinking investors.
Ready For A Different Approach?
- Explore high-performing small cap companies that haven't yet garnered significant analyst attention.
- Diversify your portfolio with solid dividend payers offering reliable income streams to weather potential market turbulence.
- Fuel your portfolio with companies showing strong growth potential, backed by optimistic outlooks both from analysts and management.
This article by Simply Wall St is general in nature. We provide commentary based on historical data and analyst forecasts only using an unbiased methodology and our articles are not intended to be financial advice. It does not constitute a recommendation to buy or sell any stock, and does not take account of your objectives, or your financial situation. We aim to bring you long-term focused analysis driven by fundamental data. Note that our analysis may not factor in the latest price-sensitive company announcements or qualitative material. Simply Wall St has no position in any stocks mentioned.
New: Manage All Your Stock Portfolios in One Place
We've created the ultimate portfolio companion for stock investors, and it's free.
• Connect an unlimited number of Portfolios and see your total in one currency
• Be alerted to new Warning Signs or Risks via email or mobile
• Track the Fair Value of your stocks
Have feedback on this article? Concerned about the content? Get in touch with us directly. Alternatively, email editorial-team@simplywallst.com
About NYSE:JBL
Jabil
Provides engineering, manufacturing, and supply chain solutions worldwide.
Reasonable growth potential with adequate balance sheet.
Similar Companies
Market Insights

Advertisement
Community Narratives
The company that turned a verb into a global necessity and basically runs the modern internet, digital ads, smartphones, maps, and AI.
Fair Value US$300.00|6.3% undervalued
OS
Community Contributor
Flowers Foods Pays A Fair Price For Health
Fair Value US$16.12|26.0% undervalued
NV
Community Contributor
TMX Group will thrive with 33.3% profit margin and enduring market moat
Fair Value CA$49.90|3.7% overvalued
LI
Community Contributor