Advertisement
The Middle Eastern stock markets have recently experienced a downturn, with Gulf indices closing lower following geopolitical tensions, notably Israel's airstrike in Qatar. Despite these challenges, investors continue to seek stability and income through dividend stocks, which can offer resilience and steady returns amidst market volatility.
Top 10 Dividend Stocks In The Middle East
| Name | Dividend Yield | Dividend Rating |
| Saudi National Bank (SASE:1180) | 5.84% | ★★★★★☆ |
| Saudi Awwal Bank (SASE:1060) | 6.51% | ★★★★★☆ |
| Riyad Bank (SASE:1010) | 6.73% | ★★★★★☆ |
| National General Insurance (P.J.S.C.) (DFM:NGI) | 7.33% | ★★★★★☆ |
| National Bank of Ras Al-Khaimah (P.S.C.) (ADX:RAKBANK) | 6.41% | ★★★★★☆ |
| Emirates NBD Bank PJSC (DFM:EMIRATESNBD) | 4.12% | ★★★★★☆ |
| Emaar Properties PJSC (DFM:EMAAR) | 7.02% | ★★★★★☆ |
| Delek Group (TASE:DLEKG) | 6.66% | ★★★★★☆ |
| Arab National Bank (SASE:1080) | 5.90% | ★★★★★☆ |
| Anadolu Hayat Emeklilik Anonim Sirketi (IBSE:ANHYT) | 6.87% | ★★★★★☆ |
Click here to see the full list of 69 stocks from our Top Middle Eastern Dividend Stocks screener.
Let's uncover some gems from our specialized screener.
Sarkuysan Elektrolitik Bakir Sanayi ve Ticaret (IBSE:SARKY)
Simply Wall St Dividend Rating: ★★★★☆☆
Overview: Sarkuysan Elektrolitik Bakir Sanayi ve Ticaret A.S. operates in Turkey, producing and trading electrolytic copper wires, copper pipes, coppering, and copper alloys, with a market cap of TRY12.44 billion.
Operations: Sarkuysan Elektrolitik Bakir Sanayi ve Ticaret A.S. generates revenue through its production and trade of electrolytic copper wires, copper pipes, coppering, and copper alloys in Turkey.
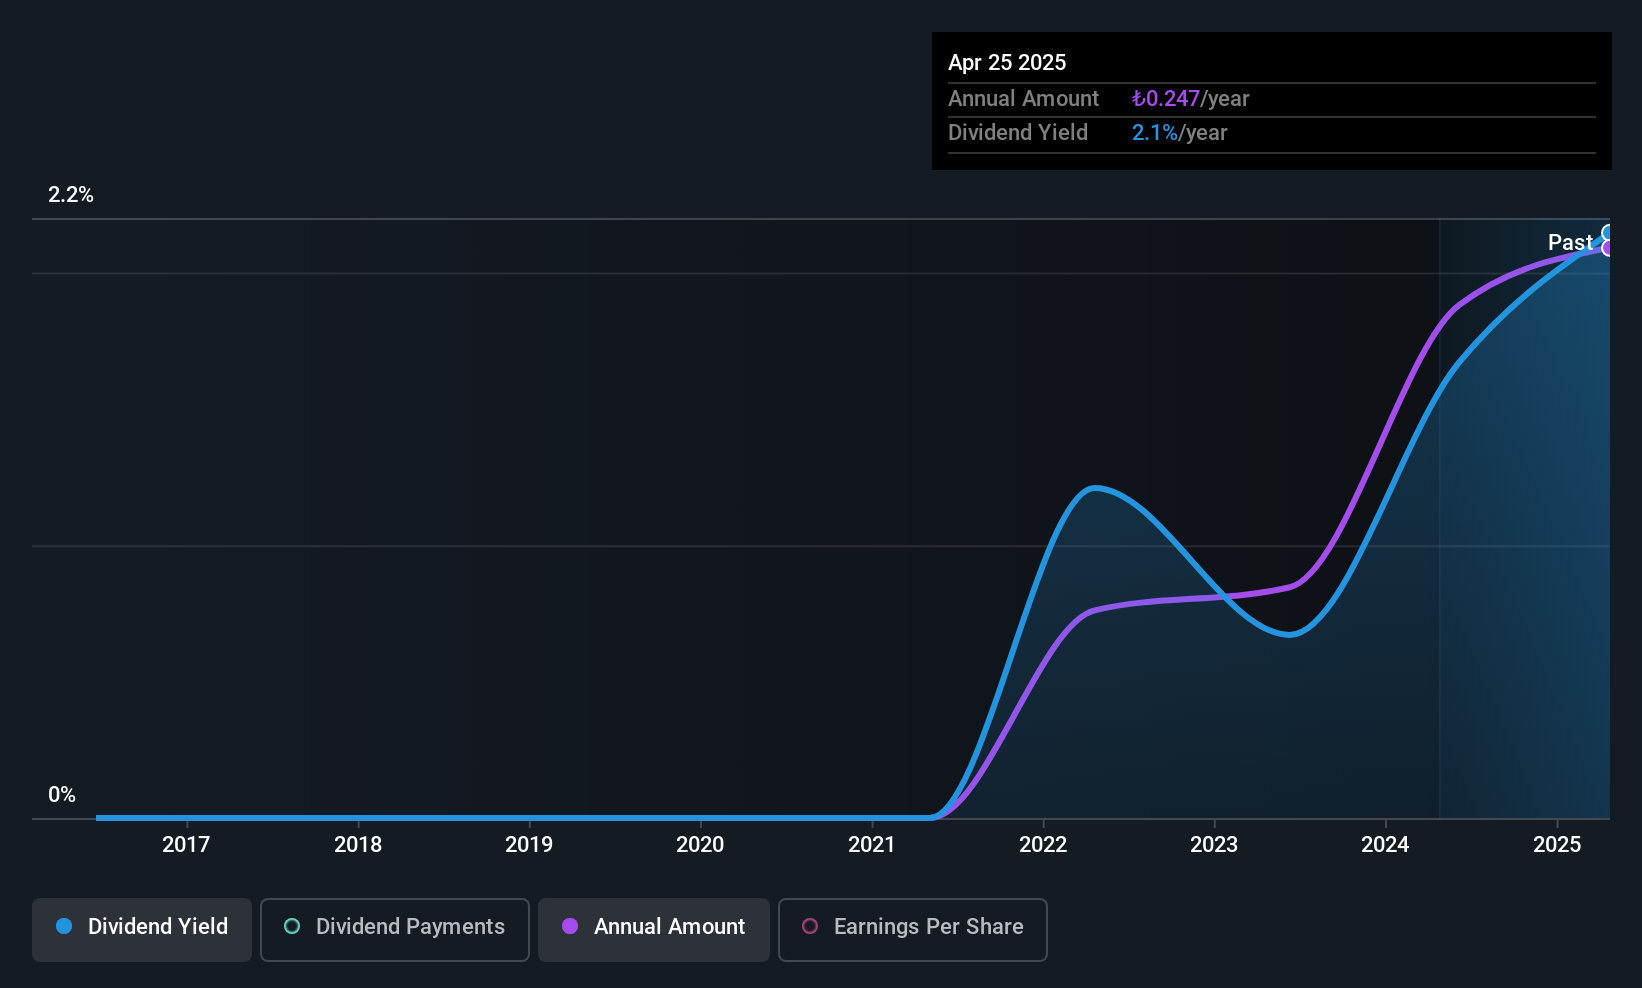
Dividend Yield: 3.3%
Sarkuysan Elektrolitik Bakir Sanayi ve Ticaret's dividend yield of 3.31% places it in the top 25% of dividend payers in Turkey. Despite a recent decline in net income, its dividends are well-covered by both earnings and cash flows, with payout ratios of 76.3% and 20.6%, respectively. However, profit margins have decreased from last year, and while dividends have been stable and growing over four years, they lack a long-term track record.
- Get an in-depth perspective on Sarkuysan Elektrolitik Bakir Sanayi ve Ticaret's performance by reading our dividend report here.
- Our valuation report here indicates Sarkuysan Elektrolitik Bakir Sanayi ve Ticaret may be overvalued.
Yapi ve Kredi Bankasi (IBSE:YKBNK)
Simply Wall St Dividend Rating: ★★★★★☆
Overview: Yapi ve Kredi Bankasi A.S. operates as a commercial bank offering a range of financial products and services in Turkey and internationally, with a market cap of TRY266.42 billion.
Operations: Yapi ve Kredi Bankasi A.S. generates revenue through various segments including Retail Banking (Incl. Private Banking and Wealth Management) at TRY97.20 billion, Treasury, Asset Liability Management and Other at TRY66.96 billion, Commercial and SME Banking at TRY55.87 billion, Corporate Banking at TRY21.27 billion, Other Domestic Operations at TRY16.09 billion, and Other Foreign Operations contributing TRY5.79 billion.
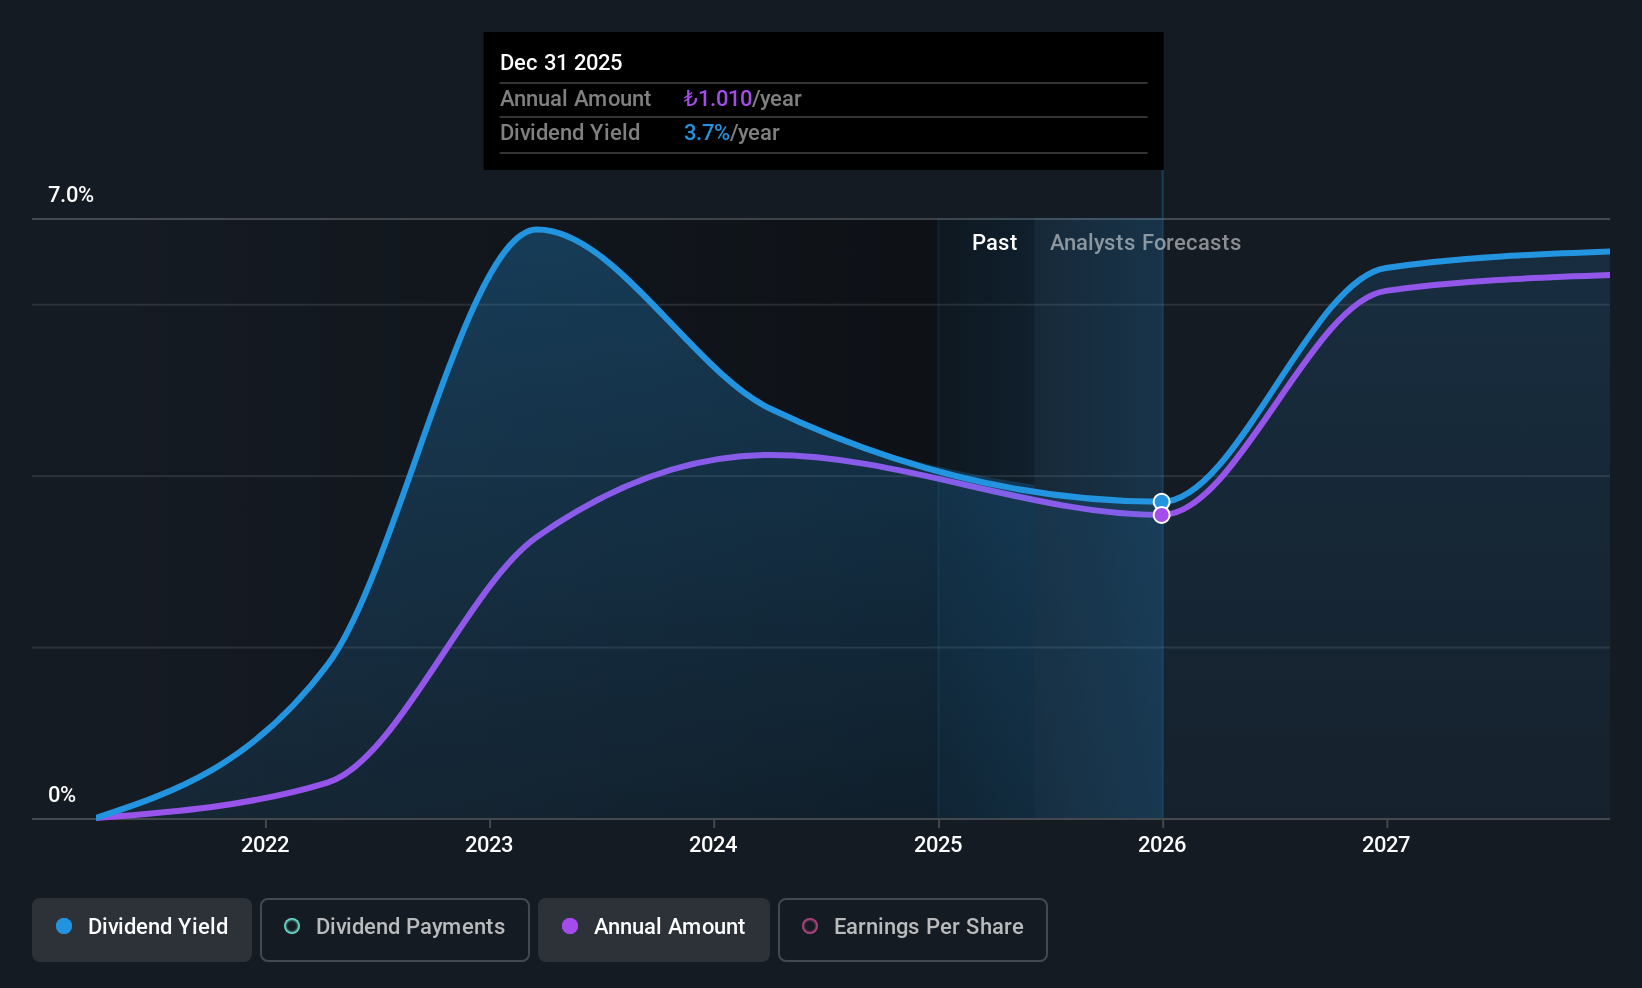
Dividend Yield: 3.8%
Yapi ve Kredi Bankasi's dividend yield of 3.84% ranks it among the top 25% in Turkey, though its dividend history has been volatile. Despite this, dividends are well-covered by earnings with a low payout ratio of 24.5%, and coverage is expected to improve further in three years. Recent financial results show significant growth in net interest income and net income year-over-year, yet profit margins have declined and bad loans remain high at 3.2%.
- Navigate through the intricacies of Yapi ve Kredi Bankasi with our comprehensive dividend report here.
- Our expertly prepared valuation report Yapi ve Kredi Bankasi implies its share price may be too high.
Suny Cellular Communication (TASE:SNCM)
Simply Wall St Dividend Rating: ★★★★☆☆
Overview: Suny Cellular Communication Ltd operates in Israel, focusing on importing and marketing cell phones, accessories, and storage devices, with a market cap of ₪336.93 million.
Operations: Suny Cellular Communication Ltd generates its revenue from the import and marketing of cell phones, accessories, and storage devices in Israel.
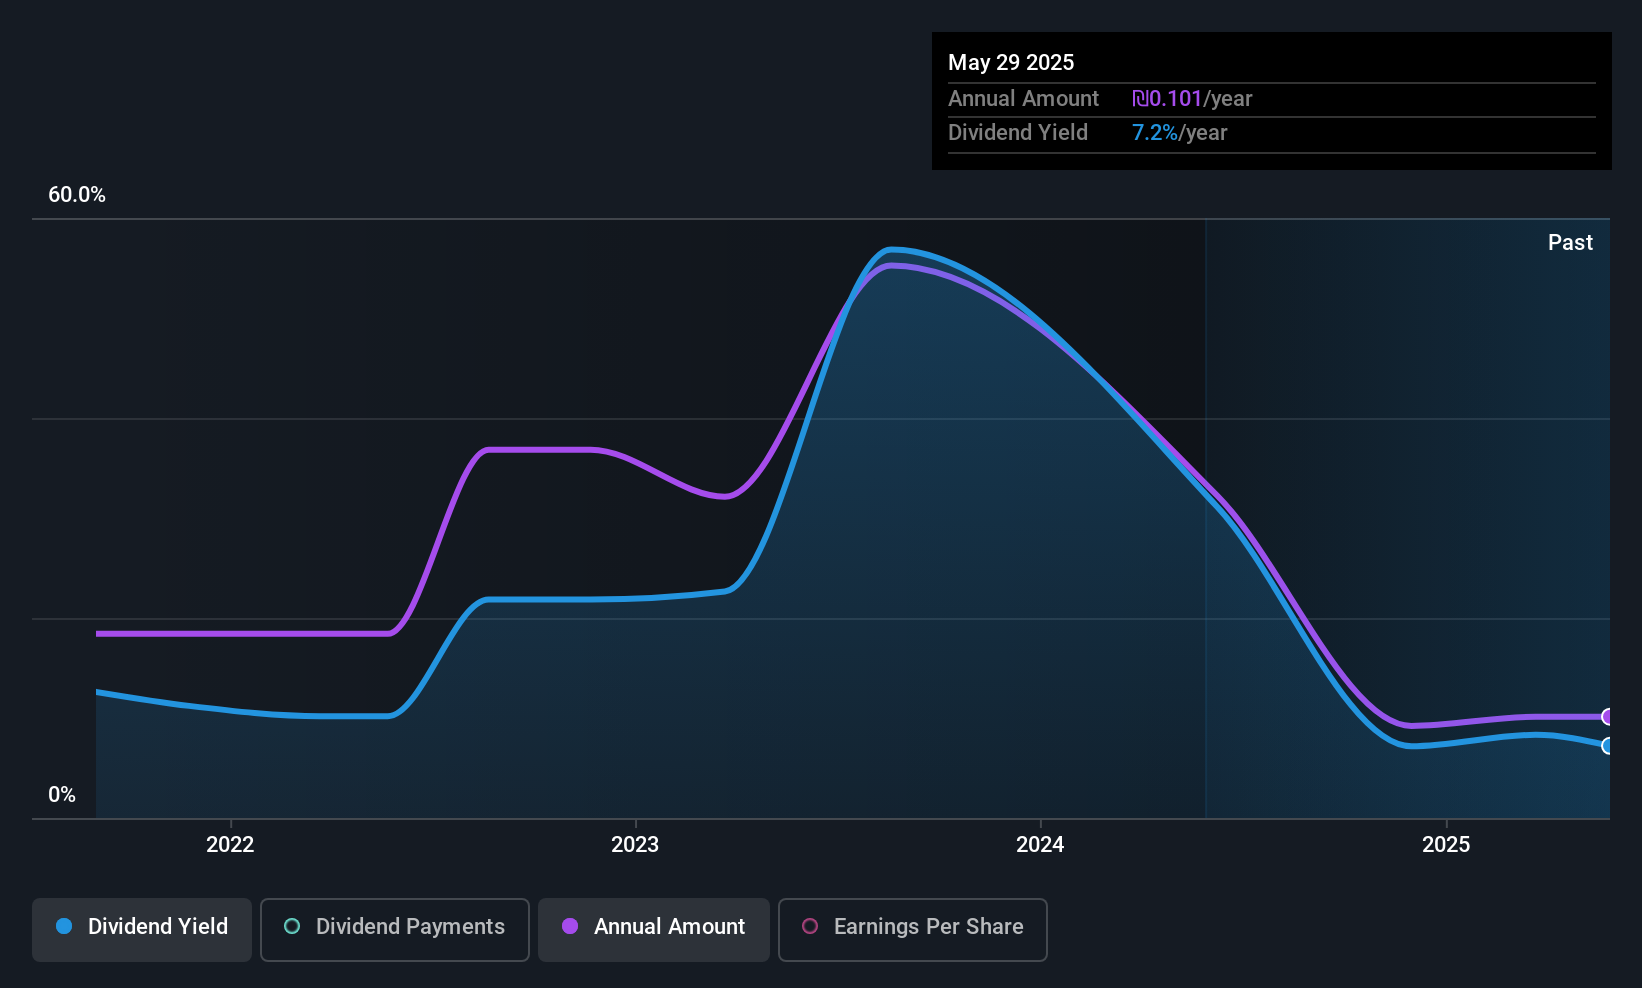
Dividend Yield: 6.5%
Suny Cellular Communication's dividend yield of 6.53% places it in the top 25% of Israeli dividend payers, supported by a reasonable payout ratio of 54.7%. However, its four-year dividend history has been marked by volatility and declining payments. Despite this instability, dividends are covered by both earnings and cash flows with a cash payout ratio of 57.1%. Recent financials indicate decreased sales and net income compared to last year, reflecting potential challenges ahead.
- Unlock comprehensive insights into our analysis of Suny Cellular Communication stock in this dividend report.
- Insights from our recent valuation report point to the potential overvaluation of Suny Cellular Communication shares in the market.
Next Steps
- Delve into our full catalog of 69 Top Middle Eastern Dividend Stocks here.
- Have you diversified into these companies? Leverage the power of Simply Wall St's portfolio to keep a close eye on market movements affecting your investments.
- Invest smarter with the free Simply Wall St app providing detailed insights into every stock market around the globe.
Searching for a Fresh Perspective?
- Explore high-performing small cap companies that haven't yet garnered significant analyst attention.
- Fuel your portfolio with companies showing strong growth potential, backed by optimistic outlooks both from analysts and management.
- Find companies with promising cash flow potential yet trading below their fair value.
This article by Simply Wall St is general in nature. We provide commentary based on historical data and analyst forecasts only using an unbiased methodology and our articles are not intended to be financial advice. It does not constitute a recommendation to buy or sell any stock, and does not take account of your objectives, or your financial situation. We aim to bring you long-term focused analysis driven by fundamental data. Note that our analysis may not factor in the latest price-sensitive company announcements or qualitative material. Simply Wall St has no position in any stocks mentioned.
New: Manage All Your Stock Portfolios in One Place
We've created the ultimate portfolio companion for stock investors, and it's free.
• Connect an unlimited number of Portfolios and see your total in one currency
• Be alerted to new Warning Signs or Risks via email or mobile
• Track the Fair Value of your stocks
Have feedback on this article? Concerned about the content? Get in touch with us directly. Alternatively, email editorial-team@simplywallst.com
About IBSE:YKBNK
Yapi ve Kredi Bankasi
Provides commercial banking and financial products and services in Turkey and internationally.
High growth potential with proven track record.
Similar Companies
Market Insights


Advertisement
Weekly Picks
ST


stuart_roberts on Upside Gold ·
An Undervalued 3.3Moz Gold Project in Canada
Fair Value:CA$5.0776.1% undervalued
208 followersusers have followed this narrative
1 commentusers have commented on this narrative
29 likesusers have liked this narrative
SI


SimpleMan887 on GameStop ·
GameStop will ace the financial crisis wave with its strategic Bitcoin investment and cash reserves
Fair Value:US$22089.6% undervalued
53 followersusers have followed this narrative
2 commentsusers have commented on this narrative
21 likesusers have liked this narrative
YI

yiannisz on Hesai Group ·
The First Real Lidar Winner
Fair Value:US$27.0719.6% undervalued
13 followersusers have followed this narrative
1 commentusers have commented on this narrative
3 likesusers have liked this narrative
TR


tripledub on Taiwan Semiconductor Manufacturing ·
The Most Wonderful Monopoly in the Most Dangerous Neighbourhood on Earth
Fair Value:US$3814.1% undervalued
10 followersusers have followed this narrative
0 commentsusers have commented on this narrative
10 likesusers have liked this narrative
Recently Updated Narratives
LO


Lou_Basenese on Giftify ·
Giftify ($GIFT): A Small-Cap Incentives Platform with More ScaleThan Its Valuation Suggests
Fair Value:US$2.558.4% undervalued
1 followerusers have followed this narrative
0 commentsusers have commented on this narrative
0 likesusers have liked this narrative
AS


AstrisCorporateAdvisory on Ceres ·
Proven business incubator in transition
Fair Value:JP¥2.37k36.4% undervalued
1 followerusers have followed this narrative
0 commentsusers have commented on this narrative
0 likesusers have liked this narrative
FA

FA_Trader on Hektar Real Estate Investment Trust ·
Hektar REIT: Outlook is getting more interesting as retail stabilises and diversification starts to kick in
Fair Value:RM 0.4910.2% undervalued
2 followersusers have followed this narrative
0 commentsusers have commented on this narrative
0 likesusers have liked this narrative
Popular Narratives
YA

Yang_ on SoFi Technologies ·
SoFi Technologies: The Apex Aggregator and the Infrastructure of the Modern Financial System
Fair Value:US$22.9829.2% undervalued
54 followersusers have followed this narrative
0 commentsusers have commented on this narrative
38 likesusers have liked this narrative
TR

tripledub on Microsoft ·
Everyone's Terrified Microsoft Will Keep Spending. I'm Terrified They'll Stop.
Fair Value:US$3955.5% undervalued
43 followersusers have followed this narrative
3 commentsusers have commented on this narrative
41 likesusers have liked this narrative
RO


Robbo on Tesla ·
The academically fascinating Tesla
Fair Value:US$301.1k% overvalued
36 followersusers have followed this narrative
11 commentsusers have commented on this narrative
31 likesusers have liked this narrative

