
Advertisement

Warren Buffett famously said, 'Volatility is far from synonymous with risk.' So it seems the smart money knows that debt - which is usually involved in bankruptcies - is a very important factor, when you assess how risky a company is. We note that Lydall, Inc. (NYSE:LDL) does have debt on its balance sheet. But should shareholders be worried about its use of debt?
When Is Debt Dangerous?
Debt and other liabilities become risky for a business when it cannot easily fulfill those obligations, either with free cash flow or by raising capital at an attractive price. Part and parcel of capitalism is the process of 'creative destruction' where failed businesses are mercilessly liquidated by their bankers. However, a more usual (but still expensive) situation is where a company must dilute shareholders at a cheap share price simply to get debt under control. Of course, plenty of companies use debt to fund growth, without any negative consequences. The first step when considering a company's debt levels is to consider its cash and debt together.
View 3 warning signs we detected for Lydall
What Is Lydall's Net Debt?
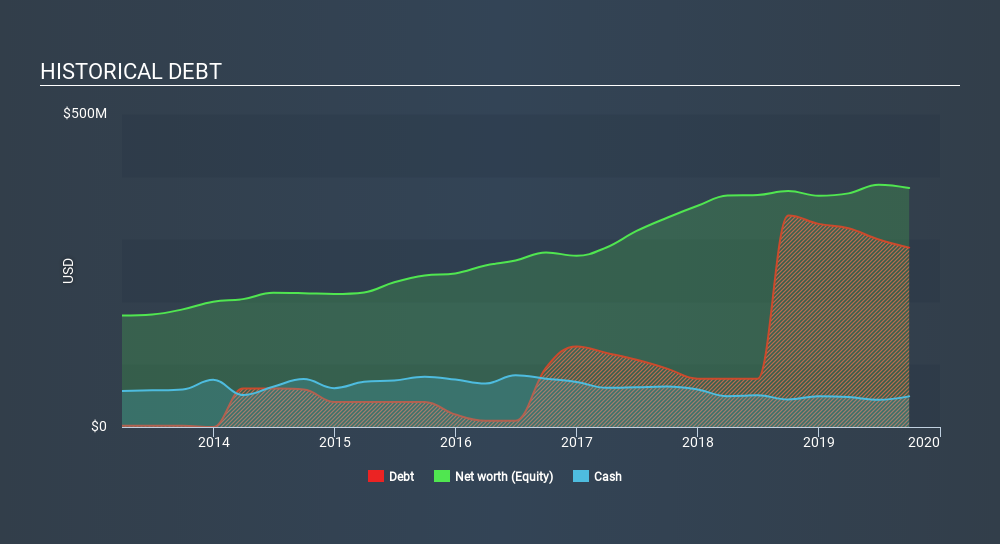
You can click the graphic below for the historical numbers, but it shows that as of September 2019 Lydall had US$286.6m of debt, an increase on US$338, over one year. However, it does have US$48.9m in cash offsetting this, leading to net debt of about US$237.7m.
How Strong Is Lydall's Balance Sheet?
The latest balance sheet data shows that Lydall had liabilities of US$140.8m due within a year, and liabilities of US$356.4m falling due after that. Offsetting these obligations, it had cash of US$48.9m as well as receivables valued at US$163.0m due within 12 months. So its liabilities total US$285.3m more than the combination of its cash and short-term receivables.
This deficit is considerable relative to its market capitalization of US$359.6m, so it does suggest shareholders should keep an eye on Lydall's use of debt. This suggests shareholders would heavily diluted if the company needed to shore up its balance sheet in a hurry.
In order to size up a company's debt relative to its earnings, we calculate its net debt divided by its earnings before interest, tax, depreciation, and amortization (EBITDA) and its earnings before interest and tax (EBIT) divided by its interest expense (its interest cover). This way, we consider both the absolute quantum of the debt, as well as the interest rates paid on it.
Lydall's debt is 2.8 times its EBITDA, and its EBIT cover its interest expense 3.4 times over. This suggests that while the debt levels are significant, we'd stop short of calling them problematic. Investors should also be troubled by the fact that Lydall saw its EBIT drop by 14% over the last twelve months. If that's the way things keep going handling the debt load will be like delivering hot coffees on a pogo stick. When analysing debt levels, the balance sheet is the obvious place to start. But ultimately, every company can contain risks that exist outside of the balance sheet. For example, we've discovered 3 warning signs for Lydall which any shareholder or potential investor should be aware of.
Finally, a company can only pay off debt with cold hard cash, not accounting profits. So the logical step is to look at the proportion of that EBIT that is matched by actual free cash flow. During the last three years, Lydall produced sturdy free cash flow equating to 59% of its EBIT, about what we'd expect. This cold hard cash means it can reduce its debt when it wants to.
Our View
On the face of it, Lydall's interest cover left us tentative about the stock, and its EBIT growth rate was no more enticing than the one empty restaurant on the busiest night of the year. But on the bright side, its conversion of EBIT to free cash flow is a good sign, and makes us more optimistic. Looking at the balance sheet and taking into account all these factors, we do believe that debt is making Lydall stock a bit risky. That's not necessarily a bad thing, but we'd generally feel more comfortable with less leverage. Above most other metrics, we think its important to track how fast earnings per share is growing, if at all. If you've also come to that realization, you're in luck, because today you can view this interactive graph of Lydall's earnings per share history for free.
At the end of the day, it's often better to focus on companies that are free from net debt. You can access our special list of such companies (all with a track record of profit growth). It's free.
If you spot an error that warrants correction, please contact the editor at editorial-team@simplywallst.com. This article by Simply Wall St is general in nature. It does not constitute a recommendation to buy or sell any stock, and does not take account of your objectives, or your financial situation. Simply Wall St has no position in the stocks mentioned.
We aim to bring you long-term focused research analysis driven by fundamental data. Note that our analysis may not factor in the latest price-sensitive company announcements or qualitative material. Thank you for reading.
Market Insights


Advertisement
Community Narratives
The Future of Drug Testing? Fingerprint Tech Shows Serious Promise
Fair Value US$2.98|40.3% undervalued
JO
Community Contributor
Suncorp’s Next Chapter: Insurance-Only and Ready to Grow
Fair Value AU$22.83|7.9% undervalued
RO
Community Contributor
Thyssenkrupp Nucera Will Achieve Double-Digit Profits by 2030 Boosted by Hydrogen Growth
Fair Value €14.40|31.6% undervalued
CH
Community Contributor
Tesla’s Nvidia Moment – The AI & Robotics Inflection Point
Fair Value US$359.72|12.3% undervalued
BL
Community Contributor