
Advertisement

Dividend paying stocks like The Weir Group PLC (LON:WEIR) tend to be popular with investors, and for good reason - some research suggests a significant amount of all stock market returns come from reinvested dividends. If you are hoping to live on your dividends, it's important to be more stringent with your investments than the average punter. Regular readers know we like to apply the same approach to each dividend stock, and we hope you'll find our analysis useful.
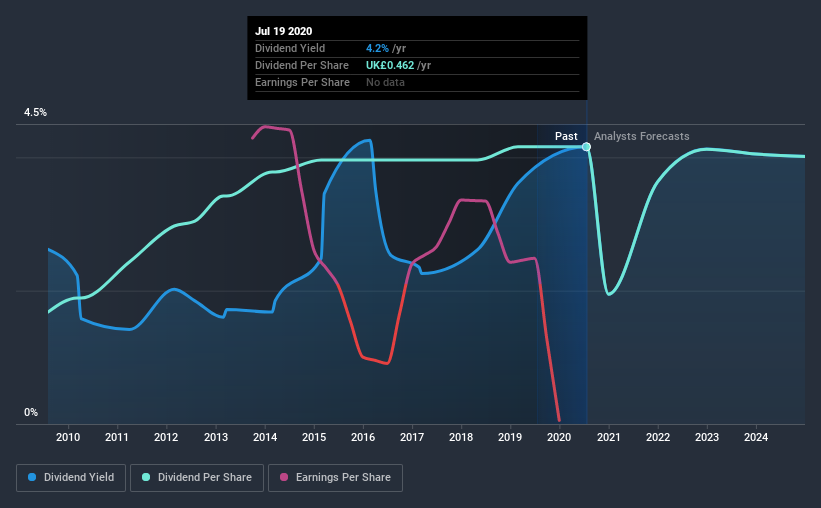
With Weir Group yielding 4.2% and having paid a dividend for over 10 years, many investors likely find the company quite interesting. It would not be a surprise to discover that many investors buy it for the dividends. That said, the recent jump in the share price will make Weir Group's dividend yield look smaller, even though the company prospects could be improving. When buying stocks for their dividends, you should always run through the checks below, to see if the dividend looks sustainable.
Explore this interactive chart for our latest analysis on Weir Group!
Payout ratios
Dividends are typically paid from company earnings. If a company pays more in dividends than it earned, then the dividend might become unsustainable - hardly an ideal situation. Comparing dividend payments to a company's net profit after tax is a simple way of reality-checking whether a dividend is sustainable. Although Weir Group pays a dividend, it was loss-making during the past year. When a company recently reported a loss, we should investigate if its cash flows covered the dividend.
Weir Group paid out 83% of its cash flow last year. This may be sustainable but it does not leave much of a buffer for unexpected circumstances.
Is Weir Group's Balance Sheet Risky?
Given Weir Group is paying a dividend but reported a loss over the past year, we need to check its balance sheet for signs of financial distress. A rough way to check this is with these two simple ratios: a) net debt divided by EBITDA (earnings before interest, tax, depreciation and amortisation), and b) net interest cover. Net debt to EBITDA is a measure of a company's total debt. Net interest cover measures the ability to meet interest payments. Essentially we check that a) the company does not have too much debt, and b) that it can afford to pay the interest. Weir Group has net debt of 2.51 times its EBITDA. Using debt can accelerate business growth, but also increases the risks.
Net interest cover can be calculated by dividing earnings before interest and tax (EBIT) by the company's net interest expense. Weir Group has EBIT of 6.46 times its interest expense, which we think is adequate.
Consider getting our latest analysis on Weir Group's financial position here.
Dividend Volatility
Before buying a stock for its income, we want to see if the dividends have been stable in the past, and if the company has a track record of maintaining its dividend. Weir Group has been paying dividends for a long time, but for the purpose of this analysis, we only examine the past 10 years of payments. During this period the dividend has been stable, which could imply the business could have relatively consistent earnings power. During the past ten-year period, the first annual payment was UK£0.2 in 2010, compared to UK£0.5 last year. Dividends per share have grown at approximately 9.5% per year over this time.
Businesses that can grow their dividends at a decent rate and maintain a stable payout can generate substantial wealth for shareholders over the long term.
Dividend Growth Potential
Dividend payments have been consistent over the past few years, but we should always check if earnings per share (EPS) are growing, as this will help maintain the purchasing power of the dividend. Earnings have grown at around 6.8% a year for the past five years, which is better than seeing them shrink! Earnings per share have been growing at a credible rate. What's more, the payout ratio is reasonable and provides some protection to the dividend, or even the potential to increase it.
Conclusion
When we look at a dividend stock, we need to form a judgement on whether the dividend will grow, if the company is able to maintain it in a wide range of economic circumstances, and if the dividend payout is sustainable. We're a bit uncomfortable with the company paying a dividend while being loss-making, although at least the dividend was covered by free cash flow. Earnings growth has been limited, but we like that the dividend payments have been fairly consistent. Ultimately, Weir Group comes up short on our dividend analysis. It's not that we think it is a bad company - just that there are likely more appealing dividend prospects out there on this analysis.
It's important to note that companies having a consistent dividend policy will generate greater investor confidence than those having an erratic one. Still, investors need to consider a host of other factors, apart from dividend payments, when analysing a company. To that end, Weir Group has 3 warning signs (and 1 which is potentially serious) we think you should know about.
Looking for more high-yielding dividend ideas? Try our curated list of dividend stocks with a yield above 3%.
When trading Weir Group or any other investment, use the platform considered by many to be the Professional's Gateway to the Worlds Market, Interactive Brokers. You get the lowest-cost* trading on stocks, options, futures, forex, bonds and funds worldwide from a single integrated account. Promoted
Valuation is complex, but we're here to simplify it.
Discover if Weir Group might be undervalued or overvalued with our detailed analysis, featuring fair value estimates, potential risks, dividends, insider trades, and its financial condition.
Access Free AnalysisThis article by Simply Wall St is general in nature. It does not constitute a recommendation to buy or sell any stock, and does not take account of your objectives, or your financial situation. We aim to bring you long-term focused analysis driven by fundamental data. Note that our analysis may not factor in the latest price-sensitive company announcements or qualitative material. Simply Wall St has no position in any stocks mentioned.
*Interactive Brokers Rated Lowest Cost Broker by StockBrokers.com Annual Online Review 2020
Have feedback on this article? Concerned about the content? Get in touch with us directly. Alternatively, email editorial-team@simplywallst.com.
About LSE:WEIR
Weir Group
Produces and sells highly engineered original equipment worldwide.
Flawless balance sheet with solid track record.
Similar Companies
Market Insights


Advertisement
Community Narratives
For the Emperor: Why Games Workshop Could Be a Star Investment
Fair Value UK£160.00|0.5% overvalued
RO
Community Contributor
Securitas will boost margins with AI and tech-driven services
Fair Value SEK 260.91|44.9% undervalued
UN
Community Contributor
A Leader in EV Charging with Growth Potential
Fair Value €27.00|21.3% undervalued
TI
Community Contributor