
Advertisement
- Hong Kong
- /
- Real Estate
- /
- SEHK:1972
Is Swire Properties Limited's (HKG:1972) High P/E Ratio A Problem For Investors?

This article is written for those who want to get better at using price to earnings ratios (P/E ratios). We'll show how you can use Swire Properties Limited's (HKG:1972) P/E ratio to inform your assessment of the investment opportunity. Swire Properties has a P/E ratio of 9.30, based on the last twelve months. In other words, at today's prices, investors are paying HK$9.30 for every HK$1 in prior year profit.
Check out our latest analysis for Swire Properties
How Do I Calculate Swire Properties's Price To Earnings Ratio?
The formula for P/E is:
Price to Earnings Ratio = Share Price ÷ Earnings per Share (EPS)
Or for Swire Properties:
P/E of 9.30 = HK$21.350 ÷ HK$2.295 (Based on the trailing twelve months to December 2019.)
(Note: the above calculation results may not be precise due to rounding.)
Is A High P/E Ratio Good?
A higher P/E ratio means that investors are paying a higher price for each HK$1 of company earnings. That is not a good or a bad thing per se, but a high P/E does imply buyers are optimistic about the future.
Does Swire Properties Have A Relatively High Or Low P/E For Its Industry?
One good way to get a quick read on what market participants expect of a company is to look at its P/E ratio. The image below shows that Swire Properties has a higher P/E than the average (6.2) P/E for companies in the real estate industry.
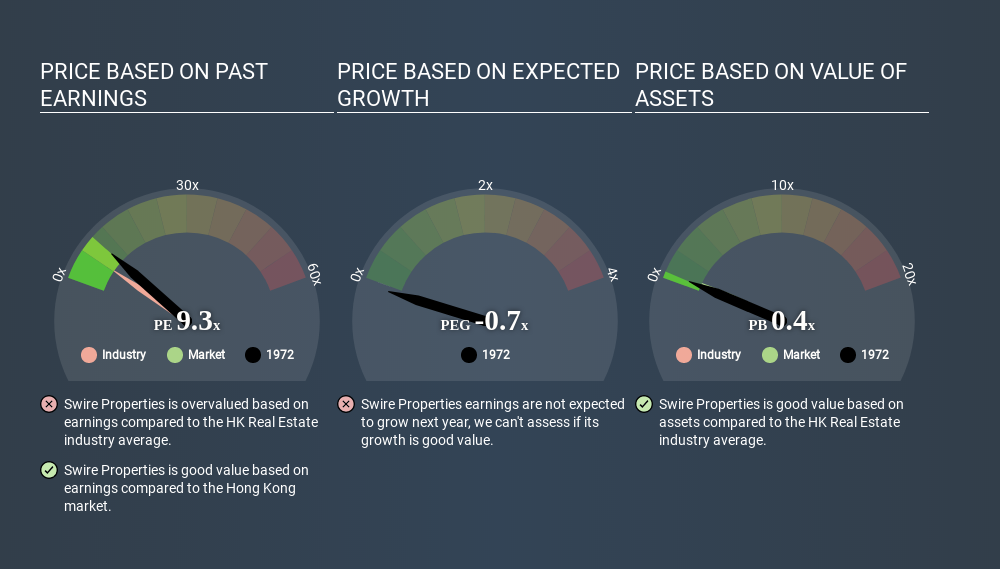
Its relatively high P/E ratio indicates that Swire Properties shareholders think it will perform better than other companies in its industry classification. Clearly the market expects growth, but it isn't guaranteed. So investors should delve deeper. I like to check if company insiders have been buying or selling.
How Growth Rates Impact P/E Ratios
If earnings fall then in the future the 'E' will be lower. Therefore, even if you pay a low multiple of earnings now, that multiple will become higher in the future. So while a stock may look cheap based on past earnings, it could be expensive based on future earnings.
Swire Properties shrunk earnings per share by 53% over the last year. But over the longer term (5 years) earnings per share have increased by 7.1%. And it has shrunk its earnings per share by 3.7% per year over the last three years. This growth rate might warrant a low P/E ratio.
Remember: P/E Ratios Don't Consider The Balance Sheet
It's important to note that the P/E ratio considers the market capitalization, not the enterprise value. That means it doesn't take debt or cash into account. In theory, a company can lower its future P/E ratio by using cash or debt to invest in growth.
Spending on growth might be good or bad a few years later, but the point is that the P/E ratio does not account for the option (or lack thereof).
So What Does Swire Properties's Balance Sheet Tell Us?
Swire Properties's net debt is 12% of its market cap. This could bring some additional risk, and reduce the number of investment options for management; worth remembering if you compare its P/E to businesses without debt.
The Verdict On Swire Properties's P/E Ratio
Swire Properties trades on a P/E ratio of 9.3, which is fairly close to the HK market average of 9.3. When you consider the lack of EPS growth last year (along with some debt), it seems the market is optimistic about the future for the business.
Investors have an opportunity when market expectations about a stock are wrong. As value investor Benjamin Graham famously said, 'In the short run, the market is a voting machine but in the long run, it is a weighing machine. So this free report on the analyst consensus forecasts could help you make a master move on this stock.
Of course, you might find a fantastic investment by looking at a few good candidates. So take a peek at this free list of companies with modest (or no) debt, trading on a P/E below 20.
If you spot an error that warrants correction, please contact the editor at editorial-team@simplywallst.com. This article by Simply Wall St is general in nature. It does not constitute a recommendation to buy or sell any stock, and does not take account of your objectives, or your financial situation. Simply Wall St has no position in the stocks mentioned.
We aim to bring you long-term focused research analysis driven by fundamental data. Note that our analysis may not factor in the latest price-sensitive company announcements or qualitative material. Thank you for reading.
About SEHK:1972
Swire Properties
Develops, owns, and operates mixed-use, primarily commercial properties in Hong Kong, Mainland China, and the United States.
Moderate growth potential with mediocre balance sheet.
Market Insights


Advertisement
Community Narratives
The Future of Drug Testing? Fingerprint Tech Shows Serious Promise
Fair Value US$2.98|38.6% undervalued
JO
Community Contributor
Suncorp’s Next Chapter: Insurance-Only and Ready to Grow
Fair Value AU$22.83|8.8% undervalued
RO
Community Contributor
Thyssenkrupp Nucera Will Achieve Double-Digit Profits by 2030 Boosted by Hydrogen Growth
Fair Value €14.40|31.3% undervalued
CH
Community Contributor
Tesla’s Nvidia Moment – The AI & Robotics Inflection Point
Fair Value US$384.84|18.0% undervalued
BL
Community Contributor