
Advertisement
- United States
- /
- Healthcare Services
- /
- NasdaqGS:NRC
Is National Research Corporation’s (NASDAQ:NRC) 57% ROCE Any Good?

Today we'll look at National Research Corporation (NASDAQ:NRC) and reflect on its potential as an investment. In particular, we'll consider its Return On Capital Employed (ROCE), as that can give us insight into how profitably the company is able to employ capital in its business.
First up, we'll look at what ROCE is and how we calculate it. Next, we'll compare it to others in its industry. And finally, we'll look at how its current liabilities are impacting its ROCE.
Understanding Return On Capital Employed (ROCE)
ROCE is a measure of a company's yearly pre-tax profit (its return), relative to the capital employed in the business. All else being equal, a better business will have a higher ROCE. Overall, it is a valuable metric that has its flaws. Renowned investment researcher Michael Mauboussin has suggested that a high ROCE can indicate that 'one dollar invested in the company generates value of more than one dollar'.
So, How Do We Calculate ROCE?
Analysts use this formula to calculate return on capital employed:
Return on Capital Employed = Earnings Before Interest and Tax (EBIT) ÷ (Total Assets - Current Liabilities)
Or for National Research:
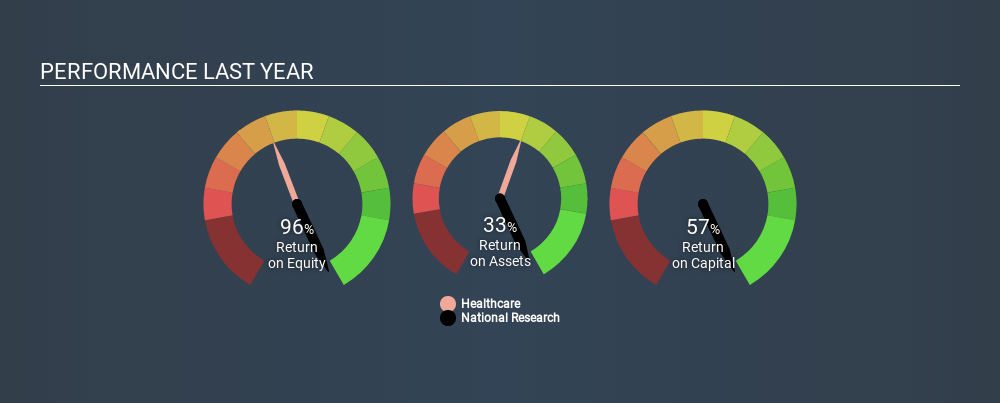
0.57 = US$44m ÷ (US$116m - US$40m) (Based on the trailing twelve months to March 2020.)
Therefore, National Research has an ROCE of 57%.
View our latest analysis for National Research
Is National Research's ROCE Good?
When making comparisons between similar businesses, investors may find ROCE useful. National Research's ROCE appears to be substantially greater than the 7.9% average in the Healthcare industry. I think that's good to see, since it implies the company is better than other companies at making the most of its capital. Putting aside its position relative to its industry for now, in absolute terms, National Research's ROCE is currently very good.
Our data shows that National Research currently has an ROCE of 57%, compared to its ROCE of 36% 3 years ago. This makes us wonder if the company is improving. You can see in the image below how National Research's ROCE compares to its industry. Click to see more on past growth.
Remember that this metric is backwards looking - it shows what has happened in the past, and does not accurately predict the future. Companies in cyclical industries can be difficult to understand using ROCE, as returns typically look high during boom times, and low during busts. This is because ROCE only looks at one year, instead of considering returns across a whole cycle. If National Research is cyclical, it could make sense to check out this free graph of past earnings, revenue and cash flow.
How National Research's Current Liabilities Impact Its ROCE
Short term (or current) liabilities, are things like supplier invoices, overdrafts, or tax bills that need to be paid within 12 months. Due to the way the ROCE equation works, having large bills due in the near term can make it look as though a company has less capital employed, and thus a higher ROCE than usual. To check the impact of this, we calculate if a company has high current liabilities relative to its total assets.
National Research has total assets of US$116m and current liabilities of US$40m. As a result, its current liabilities are equal to approximately 34% of its total assets. A medium level of current liabilities boosts National Research's ROCE somewhat.
The Bottom Line On National Research's ROCE
Despite this, it reports a high ROCE, and may be worth investigating further. National Research looks strong on this analysis, but there are plenty of other companies that could be a good opportunity . Here is a free list of companies growing earnings rapidly.
If you like to buy stocks alongside management, then you might just love this free list of companies. (Hint: insiders have been buying them).
Love or hate this article? Concerned about the content? Get in touch with us directly. Alternatively, email editorial-team@simplywallst.com.
This article by Simply Wall St is general in nature. It does not constitute a recommendation to buy or sell any stock, and does not take account of your objectives, or your financial situation. We aim to bring you long-term focused analysis driven by fundamental data. Note that our analysis may not factor in the latest price-sensitive company announcements or qualitative material. Simply Wall St has no position in any stocks mentioned. Thank you for reading.
About NasdaqGS:NRC
National Research
Provides analytics and insights that facilitate measurement and improvement of the patient and employee experience.
Second-rate dividend payer low.
Market Insights


Advertisement
Community Narratives
The Future of Drug Testing? Fingerprint Tech Shows Serious Promise
Fair Value US$2.98|38.6% undervalued
JO
Community Contributor
Suncorp’s Next Chapter: Insurance-Only and Ready to Grow
Fair Value AU$22.83|8.8% undervalued
RO
Community Contributor
Thyssenkrupp Nucera Will Achieve Double-Digit Profits by 2030 Boosted by Hydrogen Growth
Fair Value €14.40|31.6% undervalued
CH
Community Contributor
Tesla’s Nvidia Moment – The AI & Robotics Inflection Point
Fair Value US$384.84|18.0% undervalued
BL
Community Contributor