Advertisement
- United States
- /
- Packaging
- /
- NYSE:GEF
Is Greif, Inc.'s (NYSE:GEF) P/E Ratio Really That Good?
This article is for investors who would like to improve their understanding of price to earnings ratios (P/E ratios). We'll show how you can use Greif, Inc.'s (NYSE:GEF) P/E ratio to inform your assessment of the investment opportunity. What is Greif's P/E ratio? Well, based on the last twelve months it is 11.67. That means that at current prices, buyers pay $11.67 for every $1 in trailing yearly profits.
Check out our latest analysis for Greif
How Do I Calculate A Price To Earnings Ratio?
The formula for P/E is:
Price to Earnings Ratio = Price per Share ÷ Earnings per Share (EPS)
Or for Greif:
P/E of 11.67 = USD41.40 ÷ USD3.55 (Based on the year to October 2019.)
Is A High P/E Ratio Good?
A higher P/E ratio means that investors are paying a higher price for each USD1 of company earnings. All else being equal, it's better to pay a low price -- but as Warren Buffett said, 'It's far better to buy a wonderful company at a fair price than a fair company at a wonderful price'.
Does Greif Have A Relatively High Or Low P/E For Its Industry?
The P/E ratio essentially measures market expectations of a company. We can see in the image below that the average P/E (18.7) for companies in the packaging industry is higher than Greif's P/E.
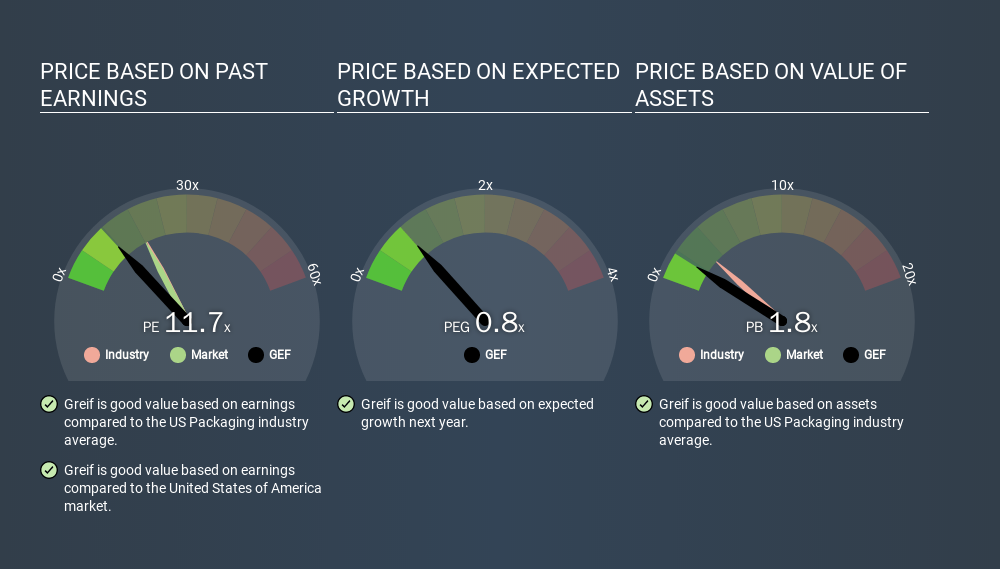
This suggests that market participants think Greif will underperform other companies in its industry. Many investors like to buy stocks when the market is pessimistic about their prospects. It is arguably worth checking if insiders are buying shares, because that might imply they believe the stock is undervalued.
How Growth Rates Impact P/E Ratios
Earnings growth rates have a big influence on P/E ratios. Earnings growth means that in the future the 'E' will be higher. That means unless the share price increases, the P/E will reduce in a few years. Then, a lower P/E should attract more buyers, pushing the share price up.
Greif's earnings per share fell by 19% in the last twelve months. But EPS is up 13% over the last 5 years.
Remember: P/E Ratios Don't Consider The Balance Sheet
It's important to note that the P/E ratio considers the market capitalization, not the enterprise value. So it won't reflect the advantage of cash, or disadvantage of debt. Hypothetically, a company could reduce its future P/E ratio by spending its cash (or taking on debt) to achieve higher earnings.
While growth expenditure doesn't always pay off, the point is that it is a good option to have; but one that the P/E ratio ignores.
Is Debt Impacting Greif's P/E?
Greif has net debt worth a very significant 126% of its market capitalization. This level of debt justifies a relatively low P/E, so remain cognizant of the debt, if you're comparing it to other stocks.
The Verdict On Greif's P/E Ratio
Greif trades on a P/E ratio of 11.7, which is below the US market average of 18.2. Given meaningful debt, and a lack of recent growth, the market looks to be extrapolating this recent performance; reflecting low expectations for the future.
Investors should be looking to buy stocks that the market is wrong about. As value investor Benjamin Graham famously said, 'In the short run, the market is a voting machine but in the long run, it is a weighing machine. So this free report on the analyst consensus forecasts could help you make a master move on this stock.
You might be able to find a better buy than Greif. If you want a selection of possible winners, check out this free list of interesting companies that trade on a P/E below 20 (but have proven they can grow earnings).
If you spot an error that warrants correction, please contact the editor at editorial-team@simplywallst.com. This article by Simply Wall St is general in nature. It does not constitute a recommendation to buy or sell any stock, and does not take account of your objectives, or your financial situation. Simply Wall St has no position in the stocks mentioned.
We aim to bring you long-term focused research analysis driven by fundamental data. Note that our analysis may not factor in the latest price-sensitive company announcements or qualitative material. Thank you for reading.
About NYSE:GEF
Greif
Produces and sells industrial packaging products and services worldwide.
Excellent balance sheet average dividend payer.
Similar Companies
Market Insights


Advertisement
Weekly Picks
LO


Lou_Basenese on Giftify ·
Giftify ($GIFT): A Small-Cap Incentives Platform with More ScaleThan Its Valuation Suggests
Fair Value:US$2.552.0% undervalued
12 followersusers have followed this narrative
0 commentsusers have commented on this narrative
4 likesusers have liked this narrative
TR


tripledub on Meta Platforms ·
The $135 Billion Bet That Should Make Every Shareholder Nervous
Fair Value:US$58013.6% overvalued
25 followersusers have followed this narrative
3 commentsusers have commented on this narrative
25 likesusers have liked this narrative
TH

TheBestInvestor on Lockheed Martin ·
Orbit + Aero + Defense
Fair Value:US$673.8821.4% undervalued
14 followersusers have followed this narrative
0 commentsusers have commented on this narrative
0 likesusers have liked this narrative
AG


Agricola on Steppe Gold ·
A case for Steppe Gold, bear case CAD $4, base case CAD $15, bull case CAD $25
Fair Value:CA$2594.4% undervalued
19 followersusers have followed this narrative
0 commentsusers have commented on this narrative
9 likesusers have liked this narrative
Recently Updated Narratives
DE

DENYAPE on Paragon Technologies ·
Deep Analysis of Paragon Technologies Inc. (PGNT): A Forensic Examination of Governance, Valuation, and Strategic Recovery
Fair Value:US$16.3472.5% undervalued
1 followerusers have followed this narrative
0 commentsusers have commented on this narrative
0 likesusers have liked this narrative
AB

abdulhayee on MCB Bank ·
MCB Bank is aiming for a fair value target of 276 with growth in sight
Fair Value:PK₨27647.6% overvalued
1 followerusers have followed this narrative
0 commentsusers have commented on this narrative
0 likesusers have liked this narrative
AN


andre_santos on CTT - Correios De Portugal ·
CTT - A Fundamental Valuation
Fair Value:€10.6740.0% undervalued
1 followerusers have followed this narrative
0 commentsusers have commented on this narrative
0 likesusers have liked this narrative
Popular Narratives
TR

tripledub on Microsoft ·
Everyone's Terrified Microsoft Will Keep Spending. I'm Terrified They'll Stop.
Fair Value:US$3955.3% overvalued
52 followersusers have followed this narrative
3 commentsusers have commented on this narrative
43 likesusers have liked this narrative
KI

Kingman1152 on NVIDIA ·
NVIDIA will see a profit margin surge of 55% in the next 5 years
Fair Value:US$305.234.6% undervalued
65 followersusers have followed this narrative
1 commentusers have commented on this narrative
22 likesusers have liked this narrative
AN

AnalystConsensusTarget on Microsoft ·
Analyst Commentary Highlights Microsoft AI Momentum and Upward Valuation Amid Growth and Competitive Risks
Fair Value:US$579.5728.3% undervalued
1384 followersusers have followed this narrative
2 commentsusers have commented on this narrative
11 likesusers have liked this narrative
Trending Discussion
TA

Taurustunez88 on Dangote Sugar Refinery ·
With the N500b rights issue, I believe Dangote sugar refinery’s loss due to FX pressures will be dra...
1
|0
