Advertisement
- United Kingdom
- /
- Aerospace & Defense
- /
- LSE:BAB
Is Babcock International Group (LON:BAB) Using Too Much Debt?
Howard Marks put it nicely when he said that, rather than worrying about share price volatility, 'The possibility of permanent loss is the risk I worry about... and every practical investor I know worries about. It's only natural to consider a company's balance sheet when you examine how risky it is, since debt is often involved when a business collapses. We note that Babcock International Group PLC (LON:BAB) does have debt on its balance sheet. But the more important question is: how much risk is that debt creating?
When Is Debt Dangerous?
Debt assists a business until the business has trouble paying it off, either with new capital or with free cash flow. Part and parcel of capitalism is the process of 'creative destruction' where failed businesses are mercilessly liquidated by their bankers. However, a more frequent (but still costly) occurrence is where a company must issue shares at bargain-basement prices, permanently diluting shareholders, just to shore up its balance sheet. By replacing dilution, though, debt can be an extremely good tool for businesses that need capital to invest in growth at high rates of return. The first thing to do when considering how much debt a business uses is to look at its cash and debt together.
Check out our latest analysis for Babcock International Group
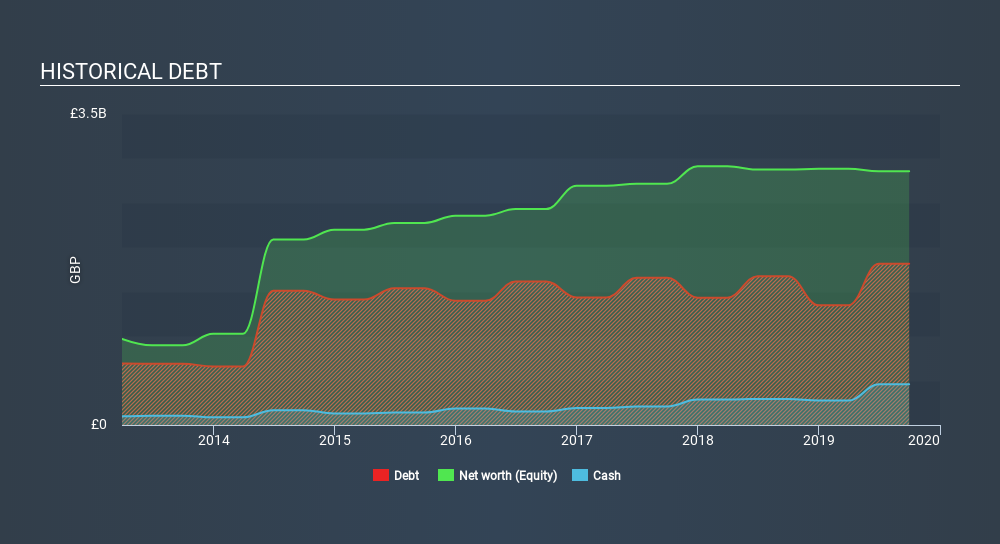
How Much Debt Does Babcock International Group Carry?
You can click the graphic below for the historical numbers, but it shows that as of September 2019 Babcock International Group had UK£1.81b of debt, an increase on UK£1.68b, over one year. However, because it has a cash reserve of UK£458.6m, its net debt is less, at about UK£1.36b.
A Look At Babcock International Group's Liabilities
Zooming in on the latest balance sheet data, we can see that Babcock International Group had liabilities of UK£1.58b due within 12 months and liabilities of UK£2.64b due beyond that. On the other hand, it had cash of UK£458.6m and UK£1.02b worth of receivables due within a year. So it has liabilities totalling UK£2.74b more than its cash and near-term receivables, combined.
When you consider that this deficiency exceeds the company's UK£2.51b market capitalization, you might well be inclined to review the balance sheet intently. In the scenario where the company had to clean up its balance sheet quickly, it seems likely shareholders would suffer extensive dilution.
In order to size up a company's debt relative to its earnings, we calculate its net debt divided by its earnings before interest, tax, depreciation, and amortization (EBITDA) and its earnings before interest and tax (EBIT) divided by its interest expense (its interest cover). This way, we consider both the absolute quantum of the debt, as well as the interest rates paid on it.
Babcock International Group's net debt of 2.5 times EBITDA suggests graceful use of debt. And the alluring interest cover (EBIT of 7.6 times interest expense) certainly does not do anything to dispel this impression. Unfortunately, Babcock International Group saw its EBIT slide 2.9% in the last twelve months. If that earnings trend continues then its debt load will grow heavy like the heart of a polar bear watching its sole cub. There's no doubt that we learn most about debt from the balance sheet. But ultimately the future profitability of the business will decide if Babcock International Group can strengthen its balance sheet over time. So if you're focused on the future you can check out this free report showing analyst profit forecasts.
But our final consideration is also important, because a company cannot pay debt with paper profits; it needs cold hard cash. So we always check how much of that EBIT is translated into free cash flow. In the last three years, Babcock International Group's free cash flow amounted to 37% of its EBIT, less than we'd expect. That weak cash conversion makes it more difficult to handle indebtedness.
Our View
We'd go so far as to say Babcock International Group's level of total liabilities was disappointing. But on the bright side, its interest cover is a good sign, and makes us more optimistic. Once we consider all the factors above, together, it seems to us that Babcock International Group's debt is making it a bit risky. Some people like that sort of risk, but we're mindful of the potential pitfalls, so we'd probably prefer it carry less debt. When analysing debt levels, the balance sheet is the obvious place to start. However, not all investment risk resides within the balance sheet - far from it. To that end, you should learn about the 2 warning signs we've spotted with Babcock International Group (including 1 which is is significant) .
If you're interested in investing in businesses that can grow profits without the burden of debt, then check out this free list of growing businesses that have net cash on the balance sheet.
If you spot an error that warrants correction, please contact the editor at editorial-team@simplywallst.com. This article by Simply Wall St is general in nature. It does not constitute a recommendation to buy or sell any stock, and does not take account of your objectives, or your financial situation. Simply Wall St has no position in the stocks mentioned.
We aim to bring you long-term focused research analysis driven by fundamental data. Note that our analysis may not factor in the latest price-sensitive company announcements or qualitative material. Thank you for reading.
About LSE:BAB
Babcock International Group
Engages in the design, development, manufacture, and integration of specialist systems for aerospace, defense, and security in the United Kingdom, rest of Europe, Africa, North America, Australasia, and internationally.
Undervalued with excellent balance sheet.
Similar Companies
Market Insights


Advertisement
Weekly Picks
LO


Lou_Basenese on Giftify ·
Giftify ($GIFT): A Small-Cap Incentives Platform with More ScaleThan Its Valuation Suggests
Fair Value:US$2.563.5% undervalued
49 followersusers have followed this narrative
2 commentsusers have commented on this narrative
9 likesusers have liked this narrative
HA


HarishPK on lululemon athletica ·
Quantifying the Transition: Why Lululemon’s Moat Remains Intact
Fair Value:US$161.826.3% undervalued
21 followersusers have followed this narrative
2 commentsusers have commented on this narrative
9 likesusers have liked this narrative
TR


tripledub on Alphabet ·
Warren Buffett Just Bet $10 Billion on Google. The Catch? You May Already Be Too Late.
Fair Value:US$23055.3% overvalued
54 followersusers have followed this narrative
1 commentusers have commented on this narrative
14 likesusers have liked this narrative
JO


John_Eric on Veeva Systems ·
AI-Powered Veeva Systems Poised for Solid Growth Amid Regulatory Stability
Fair Value:US$32040.6% undervalued
31 followersusers have followed this narrative
0 commentsusers have commented on this narrative
5 likesusers have liked this narrative
Recently Updated Narratives
WA

Wavefarer on Accenture ·
High-quality global services company facing an AI-driven valuation reset.
Fair Value:US$30155.1% undervalued
1 followerusers have followed this narrative
0 commentsusers have commented on this narrative
0 likesusers have liked this narrative
BI

bip59 on Apple ·
Perfect Hardware, Dated Software: Why I See Apple at $100 in 3 Years
Fair Value:US$100215.3% overvalued
5 followersusers have followed this narrative
0 commentsusers have commented on this narrative
0 likesusers have liked this narrative
LI
Lijo on Accenture ·
A value stock that's undervalued.
Fair Value:US$18326.1% undervalued
5 followersusers have followed this narrative
0 commentsusers have commented on this narrative
0 likesusers have liked this narrative
Popular Narratives
IN


Investingwilly on Mastercard ·
Mastercard: The Best Dividend Stock You're Ignoring
Fair Value:US$75029.8% undervalued
87 followersusers have followed this narrative
1 commentusers have commented on this narrative
9 likesusers have liked this narrative
BL


BlackGoat on Cerebras Systems ·
The Wafer Giant Threatening NVIDIA's GPU Hegemony
Fair Value:US$415.5448.2% undervalued
60 followersusers have followed this narrative
3 commentsusers have commented on this narrative
11 likesusers have liked this narrative
HE


HedgeY on Quanta Services ·
The Picks-and-Shovels Leader of the Grid Supercycle
Fair Value:US$7107.2% undervalued
53 followersusers have followed this narrative
0 commentsusers have commented on this narrative
6 likesusers have liked this narrative
