
Advertisement
- United States
- /
- Auto Components
- /
- NasdaqGS:VC
How Does Visteon's (NASDAQ:VC) P/E Compare To Its Industry, After The Share Price Drop?

To the annoyance of some shareholders, Visteon (NASDAQ:VC) shares are down a considerable 41% in the last month. Indeed the recent decline has arguably caused some bitterness for shareholders who have held through the 46% drop over twelve months.
Assuming nothing else has changed, a lower share price makes a stock more attractive to potential buyers. While the market sentiment towards a stock is very changeable, in the long run, the share price will tend to move in the same direction as earnings per share. So, on certain occasions, long term focussed investors try to take advantage of pessimistic expectations to buy shares at a better price. One way to gauge market expectations of a stock is to look at its Price to Earnings Ratio (PE Ratio). A high P/E ratio means that investors have a high expectation about future growth, while a low P/E ratio means they have low expectations about future growth.
Check out our latest analysis for Visteon
Does Visteon Have A Relatively High Or Low P/E For Its Industry?
We can tell from its P/E ratio of 16.02 that there is some investor optimism about Visteon. The image below shows that Visteon has a higher P/E than the average (11.0) P/E for companies in the auto components industry.
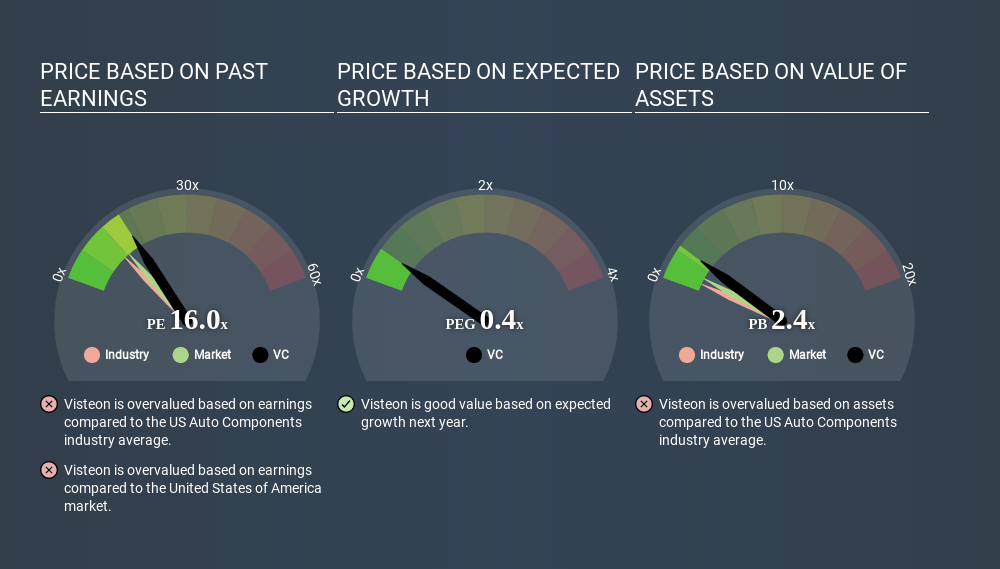
Visteon's P/E tells us that market participants think the company will perform better than its industry peers, going forward. The market is optimistic about the future, but that doesn't guarantee future growth. So investors should always consider the P/E ratio alongside other factors, such as whether company directors have been buying shares.
How Growth Rates Impact P/E Ratios
When earnings fall, the 'E' decreases, over time. Therefore, even if you pay a low multiple of earnings now, that multiple will become higher in the future. So while a stock may look cheap based on past earnings, it could be expensive based on future earnings.
Visteon's earnings per share fell by 54% in the last twelve months. And EPS is down 8.4% a year, over the last 3 years. This could justify a low P/E.
Remember: P/E Ratios Don't Consider The Balance Sheet
One drawback of using a P/E ratio is that it considers market capitalization, but not the balance sheet. Thus, the metric does not reflect cash or debt held by the company. Theoretically, a business can improve its earnings (and produce a lower P/E in the future) by investing in growth. That means taking on debt (or spending its cash).
Such expenditure might be good or bad, in the long term, but the point here is that the balance sheet is not reflected by this ratio.
How Does Visteon's Debt Impact Its P/E Ratio?
Since Visteon holds net cash of US$81m, it can spend on growth, justifying a higher P/E ratio than otherwise.
The Verdict On Visteon's P/E Ratio
Visteon trades on a P/E ratio of 16.0, which is above its market average of 12.5. The recent drop in earnings per share might keep value investors away, but the healthy balance sheet means the company retains the potential for future growth. If this growth fails to materialise, the current high P/E could prove to be temporary, as the share price falls. Given Visteon's P/E ratio has declined from 27.1 to 16.0 in the last month, we know for sure that the market is significantly less confident about the business today, than it was back then. For those who prefer to invest with the flow of momentum, that might be a bad sign, but for a contrarian, it may signal opportunity.
When the market is wrong about a stock, it gives savvy investors an opportunity. As value investor Benjamin Graham famously said, 'In the short run, the market is a voting machine but in the long run, it is a weighing machine. So this free visual report on analyst forecasts could hold the key to an excellent investment decision.
Of course, you might find a fantastic investment by looking at a few good candidates. So take a peek at this free list of companies with modest (or no) debt, trading on a P/E below 20.
If you spot an error that warrants correction, please contact the editor at editorial-team@simplywallst.com. This article by Simply Wall St is general in nature. It does not constitute a recommendation to buy or sell any stock, and does not take account of your objectives, or your financial situation. Simply Wall St has no position in the stocks mentioned.
We aim to bring you long-term focused research analysis driven by fundamental data. Note that our analysis may not factor in the latest price-sensitive company announcements or qualitative material. Thank you for reading.
About NasdaqGS:VC
Visteon
An automotive technology company, designs, manufactures, and sells automotive electronics and connected car solutions for vehicle manufacturers.
Flawless balance sheet and good value.
Similar Companies
Market Insights


Advertisement
Community Narratives
The Future of Drug Testing? Fingerprint Tech Shows Serious Promise
Fair Value US$2.98|40.3% undervalued
JO
Community Contributor
Suncorp’s Next Chapter: Insurance-Only and Ready to Grow
Fair Value AU$22.83|8.8% undervalued
RO
Community Contributor
Thyssenkrupp Nucera Will Achieve Double-Digit Profits by 2030 Boosted by Hydrogen Growth
Fair Value €14.40|31.3% undervalued
CH
Community Contributor
Tesla’s Nvidia Moment – The AI & Robotics Inflection Point
Fair Value US$384.84|18.1% undervalued
BL
Community Contributor