
Advertisement
- India
- /
- Metals and Mining
- /
- NSEI:VEDL
How Does Vedanta's (NSE:VEDL) P/E Compare To Its Industry, After Its Big Share Price Gain?
Those holding Vedanta (NSE:VEDL) shares must be pleased that the share price has rebounded 43% in the last thirty days. But unfortunately, the stock is still down by 34% over a quarter. But shareholders may not all be feeling jubilant, since the share price is still down 47% in the last year.
All else being equal, a sharp share price increase should make a stock less attractive to potential investors. While the market sentiment towards a stock is very changeable, in the long run, the share price will tend to move in the same direction as earnings per share. So some would prefer to hold off buying when there is a lot of optimism towards a stock. One way to gauge market expectations of a stock is to look at its Price to Earnings Ratio (PE Ratio). A high P/E ratio means that investors have a high expectation about future growth, while a low P/E ratio means they have low expectations about future growth.
View our latest analysis for Vedanta
Does Vedanta Have A Relatively High Or Low P/E For Its Industry?
We can tell from its P/E ratio of 3.91 that sentiment around Vedanta isn't particularly high. We can see in the image below that the average P/E (7.1) for companies in the metals and mining industry is higher than Vedanta's P/E.
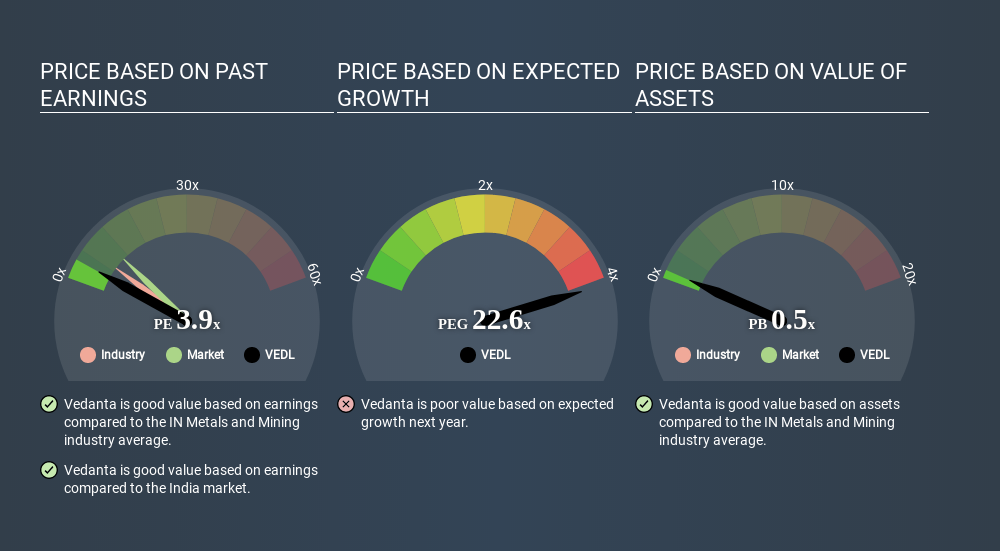
Vedanta's P/E tells us that market participants think it will not fare as well as its peers in the same industry. Many investors like to buy stocks when the market is pessimistic about their prospects. You should delve deeper. I like to check if company insiders have been buying or selling.
How Growth Rates Impact P/E Ratios
Generally speaking the rate of earnings growth has a profound impact on a company's P/E multiple. When earnings grow, the 'E' increases, over time. Therefore, even if you pay a high multiple of earnings now, that multiple will become lower in the future. Then, a lower P/E should attract more buyers, pushing the share price up.
Vedanta shrunk earnings per share by 7.1% last year. But EPS is up 5.4% over the last 5 years.
Don't Forget: The P/E Does Not Account For Debt or Bank Deposits
The 'Price' in P/E reflects the market capitalization of the company. Thus, the metric does not reflect cash or debt held by the company. Hypothetically, a company could reduce its future P/E ratio by spending its cash (or taking on debt) to achieve higher earnings.
Such expenditure might be good or bad, in the long term, but the point here is that the balance sheet is not reflected by this ratio.
Is Debt Impacting Vedanta's P/E?
Vedanta has net debt worth 61% of its market capitalization. This is a reasonably significant level of debt -- all else being equal you'd expect a much lower P/E than if it had net cash.
The Bottom Line On Vedanta's P/E Ratio
Vedanta has a P/E of 3.9. That's below the average in the IN market, which is 10.4. The P/E reflects market pessimism that probably arises from the lack of recent EPS growth, paired with significant leverage. What is very clear is that the market has become less pessimistic about Vedanta over the last month, with the P/E ratio rising from 2.7 back then to 3.9 today. If you like to buy stocks that could be turnaround opportunities, then this one might be a candidate; but if you're more sensitive to price, then you may feel the opportunity has passed.
When the market is wrong about a stock, it gives savvy investors an opportunity. If the reality for a company is not as bad as the P/E ratio indicates, then the share price should increase as the market realizes this. So this free visual report on analyst forecasts could hold the key to an excellent investment decision.
But note: Vedanta may not be the best stock to buy. So take a peek at this free list of interesting companies with strong recent earnings growth (and a P/E ratio below 20).
If you spot an error that warrants correction, please contact the editor at editorial-team@simplywallst.com. This article by Simply Wall St is general in nature. It does not constitute a recommendation to buy or sell any stock, and does not take account of your objectives, or your financial situation. Simply Wall St has no position in the stocks mentioned.
We aim to bring you long-term focused research analysis driven by fundamental data. Note that our analysis may not factor in the latest price-sensitive company announcements or qualitative material. Thank you for reading.
About NSEI:VEDL
Vedanta
A diversified natural resources company, explores, extracts, and processes minerals, and oil and gas in India, Europe, China, the United States, Mexico, and internationally.
Undervalued with solid track record and pays a dividend.
Market Insights


Advertisement
Community Narratives
For the Emperor: Why Games Workshop Could Be a Star Investment
Fair Value UK£160.00|0.4% undervalued
RO
Community Contributor
Securitas will boost margins with AI and tech-driven services
Fair Value SEK 260.91|45.0% undervalued
UN
Community Contributor
A Leader in EV Charging with Growth Potential
Fair Value €27.00|20.4% undervalued
TI
Community Contributor