Advertisement
- South Korea
- /
- Packaging
- /
- KOSDAQ:A014970
How Does SAMRYOONG Co.,Ltd (KOSDAQ:014970) Fare As A Dividend Stock?
Dividend paying stocks like SAMRYOONG Co.,Ltd (KOSDAQ:014970) tend to be popular with investors, and for good reason - some research suggests a significant amount of all stock market returns come from reinvested dividends. If you are hoping to live on your dividends, it's important to be more stringent with your investments than the average punter. Regular readers know we like to apply the same approach to each dividend stock, and we hope you'll find our analysis useful.
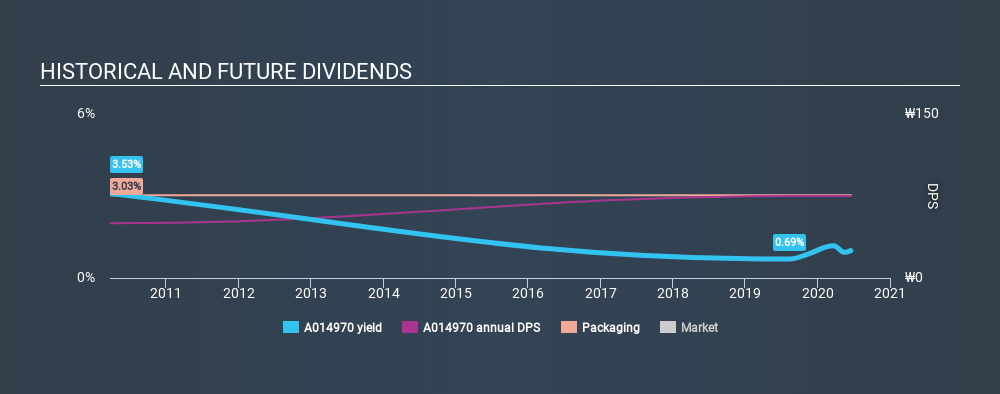
A 1.0% yield is nothing to get excited about, but investors probably think the long payment history suggests SAMRYOONGLtd has some staying power. That said, the recent jump in the share price will make SAMRYOONGLtd's dividend yield look smaller, even though the company prospects could be improving. When buying stocks for their dividends, you should always run through the checks below, to see if the dividend looks sustainable.
Click the interactive chart for our full dividend analysis
Payout ratios
Dividends are typically paid from company earnings. If a company pays more in dividends than it earned, then the dividend might become unsustainable - hardly an ideal situation. Comparing dividend payments to a company's net profit after tax is a simple way of reality-checking whether a dividend is sustainable. SAMRYOONGLtd paid out 79% of its profit as dividends, over the trailing twelve month period. Paying out a majority of its earnings limits the amount that can be reinvested in the business. This may indicate a commitment to paying a dividend, or a dearth of investment opportunities.
Another important check we do is to see if the free cash flow generated is sufficient to pay the dividend. SAMRYOONGLtd paid out 19% of its free cash flow as dividends last year, which is conservative and suggests the dividend is sustainable. It's encouraging to see that the dividend is covered by both profit and cash flow. This generally suggests the dividend is sustainable, as long as earnings don't drop precipitously.
Is SAMRYOONGLtd's Balance Sheet Risky?
As SAMRYOONGLtd has a meaningful amount of debt, we need to check its balance sheet to see if the company might have debt risks. A quick check of its financial situation can be done with two ratios: net debt divided by EBITDA (earnings before interest, tax, depreciation and amortisation), and net interest cover. Net debt to EBITDA is a measure of a company's total debt. Net interest cover measures the ability to meet interest payments. Essentially we check that a) the company does not have too much debt, and b) that it can afford to pay the interest. With net debt of 2.21 times its EBITDA, SAMRYOONGLtd's debt burden is within a normal range for most listed companies.
Net interest cover can be calculated by dividing earnings before interest and tax (EBIT) by the company's net interest expense. Interest cover of 1.71 times its interest expense is starting to become a concern for SAMRYOONGLtd, and be aware that lenders may place additional restrictions on the company as well.
Consider getting our latest analysis on SAMRYOONGLtd's financial position here.
Dividend Volatility
Before buying a stock for its income, we want to see if the dividends have been stable in the past, and if the company has a track record of maintaining its dividend. SAMRYOONGLtd has been paying dividends for a long time, but for the purpose of this analysis, we only examine the past 10 years of payments. The dividend has been stable over the past 10 years, which is great. We think this could suggest some resilience to the business and its dividends. During the past ten-year period, the first annual payment was ₩50.00 in 2010, compared to ₩75.00 last year. Dividends per share have grown at approximately 4.1% per year over this time.
Slow and steady dividend growth might not sound that exciting, but dividends have been stable for ten years, which we think is seriously impressive.
Dividend Growth Potential
Dividend payments have been consistent over the past few years, but we should always check if earnings per share (EPS) are growing, as this will help maintain the purchasing power of the dividend. It's not great to see that SAMRYOONGLtd's have fallen at approximately 4.8% over the past five years. If earnings continue to decline, the dividend may come under pressure. Every investor should make an assessment of whether the company is taking steps to stabilise the situation.
We'd also point out that SAMRYOONGLtd issued a meaningful number of new shares in the past year. Trying to grow the dividend when issuing new shares reminds us of the ancient Greek tale of Sisyphus - perpetually pushing a boulder uphill. Companies that consistently issue new shares are often suboptimal from a dividend perspective.
Conclusion
When we look at a dividend stock, we need to form a judgement on whether the dividend will grow, if the company is able to maintain it in a wide range of economic circumstances, and if the dividend payout is sustainable. First, we think SAMRYOONGLtd has an acceptable payout ratio and its dividend is well covered by cashflow. Second, earnings per share have actually shrunk, but at least the dividends have been relatively stable. While we're not hugely bearish on it, overall we think there are potentially better dividend stocks than SAMRYOONGLtd out there.
Investors generally tend to favour companies with a consistent, stable dividend policy as opposed to those operating an irregular one. Meanwhile, despite the importance of dividend payments, they are not the only factors our readers should know when assessing a company. For example, we've identified 6 warning signs for SAMRYOONGLtd (2 are potentially serious!) that you should be aware of before investing.
If you are a dividend investor, you might also want to look at our curated list of dividend stocks yielding above 3%.
Love or hate this article? Concerned about the content? Get in touch with us directly. Alternatively, email editorial-team@simplywallst.com.
This article by Simply Wall St is general in nature. It does not constitute a recommendation to buy or sell any stock, and does not take account of your objectives, or your financial situation. We aim to bring you long-term focused analysis driven by fundamental data. Note that our analysis may not factor in the latest price-sensitive company announcements or qualitative material. Simply Wall St has no position in any stocks mentioned. Thank you for reading.
About KOSDAQ:A014970
SAMRYOONGLtd
Provides liquid packaging products in South Korea.
Excellent balance sheet with questionable track record.
Market Insights


Advertisement
Weekly Picks
ST


stuart_roberts on Upside Gold ·
An Undervalued 3.3Moz Gold Project in Canada
Fair Value:CA$5.0774.4% undervalued
218 followersusers have followed this narrative
1 commentusers have commented on this narrative
31 likesusers have liked this narrative
SI


SimpleMan887 on GameStop ·
GameStop will ace the financial crisis wave with its strategic Bitcoin investment and cash reserves
Fair Value:US$22089.4% undervalued
55 followersusers have followed this narrative
2 commentsusers have commented on this narrative
21 likesusers have liked this narrative
YI

yiannisz on Hesai Group ·
The First Real Lidar Winner
Fair Value:US$27.0716.3% undervalued
14 followersusers have followed this narrative
1 commentusers have commented on this narrative
4 likesusers have liked this narrative
TR


tripledub on Taiwan Semiconductor Manufacturing ·
The Most Wonderful Monopoly in the Most Dangerous Neighbourhood on Earth
Fair Value:US$3812.7% undervalued
12 followersusers have followed this narrative
0 commentsusers have commented on this narrative
13 likesusers have liked this narrative
Recently Updated Narratives
TA


Talos on 5E Advanced Materials ·
5E Advanced Materials (FEAM): A Binary Critical Minerals Play with a $6.65 Fair Value Target
Fair Value:US$6.6577.4% undervalued
1 followerusers have followed this narrative
0 commentsusers have commented on this narrative
0 likesusers have liked this narrative
53

537578 on Recursion Pharmaceuticals ·
Recursion Pharmaceuticals! WTH is going on?
Fair Value:US$1.9766.5% overvalued
8 followersusers have followed this narrative
0 commentsusers have commented on this narrative
0 likesusers have liked this narrative
RO


Robbo on Visa ·
Visa and the Case for Patience in Premium Businesses
Fair Value:US$2808.7% overvalued
1 followerusers have followed this narrative
0 commentsusers have commented on this narrative
0 likesusers have liked this narrative
Popular Narratives
TR

tripledub on Microsoft ·
Everyone's Terrified Microsoft Will Keep Spending. I'm Terrified They'll Stop.
Fair Value:US$3956.1% undervalued
45 followersusers have followed this narrative
3 commentsusers have commented on this narrative
42 likesusers have liked this narrative
RO

Robbo on Tesla ·
The academically fascinating Tesla
Fair Value:US$301.1k% overvalued
37 followersusers have followed this narrative
11 commentsusers have commented on this narrative
31 likesusers have liked this narrative
AN

AnalystConsensusTarget on Microsoft ·
Analyst Commentary Highlights Microsoft AI Momentum and Upward Valuation Amid Growth and Competitive Risks
Fair Value:US$587.3136.9% undervalued
1351 followersusers have followed this narrative
2 commentsusers have commented on this narrative
11 likesusers have liked this narrative
Trending Discussion

EL

Element1 on Greatland Resources ·
I can’t believe how inaccurate and out of date this site is—and people rely on it. Greatland owns tw...
0
|0
MI

Mikeymike on Auxly Cannabis Group ·
Id like to understand why they believe the profit margin is going decline so dramatically. Is it ene...
0
|0